FXEM - EMPIRE MARKETS - Company New Article
To access the website's classic version and the new accounts, please click here
Feb 25, 2026
 |
|
|
 |
|
|
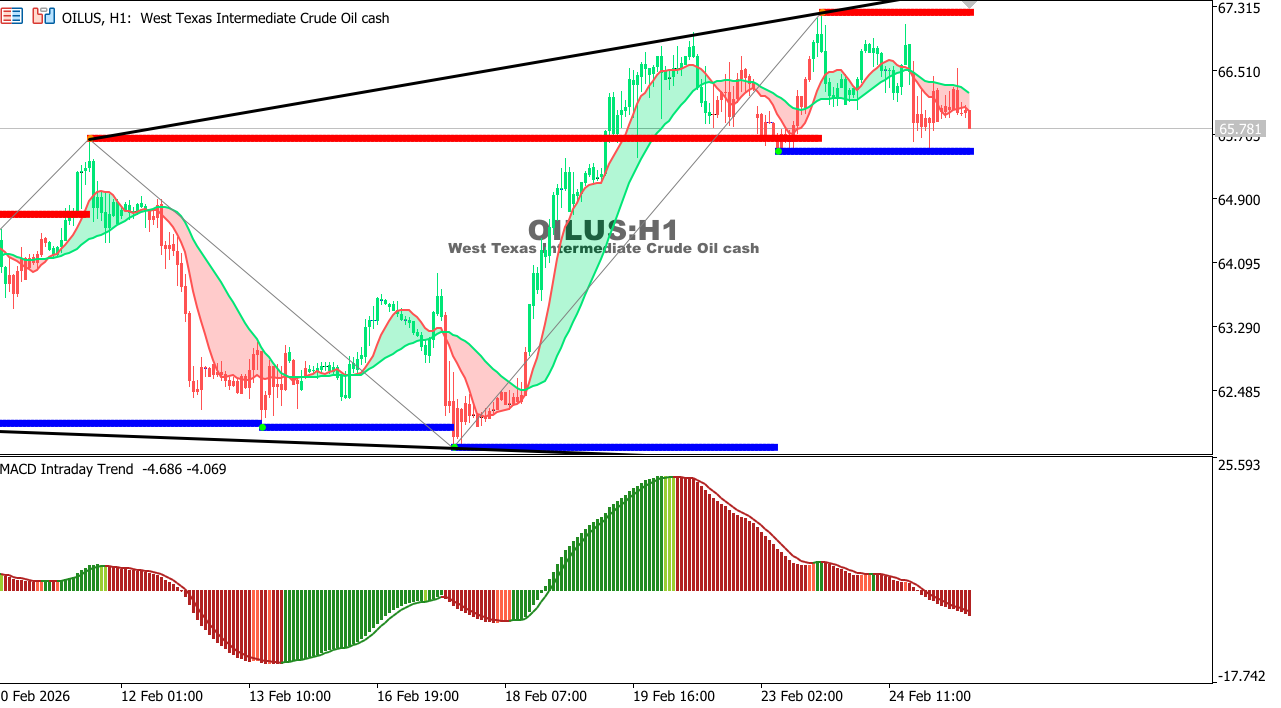 |
USOIL Chart on the hourly time frameOil is moving sideways with a slight upward bias after a previous pullback, but it remains below key resistance levels. Momentum is gradually improving without a confirmed breakout. General Trend: Neutral with a slight upward bias Expectation: A break above 66.90 could push towards 68.00, while a failure could bring prices back to test 64.50.
|
 |
|
|
 |
|
|