FXEM - EMPIRE MARKETS - Company New Article
To access the website's classic version and the new accounts, please click here
Feb 24, 2026
 |
|
|
 |
|
|
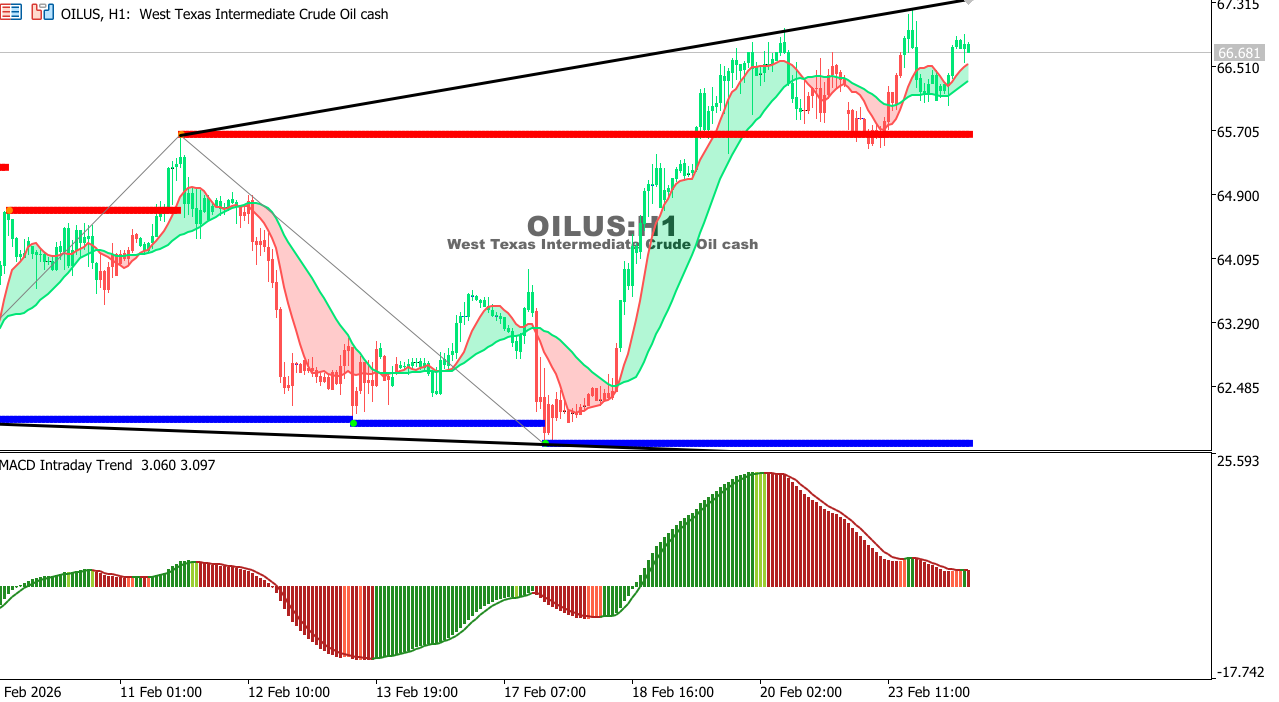 |
USOIL Chart on the hourly time frameOil is attempting a gradual recovery after a previous decline, currently trading near 66.68 while testing the 67.00 resistance area. Short-term momentum is leaning positive. A break above 67.00 could extend gains toward 69.00, while a move below 65.50 would reintroduce downside pressure. Overall Trend: Neutral to Bullish Outlook: Holding above 65.50 supports further recovery.
|
 |
|
|
 |
|
|