FXEM - EMPIRE MARKETS - Company New Article
To access the website's classic version and the new accounts, please click here
Feb 17, 2026
 |
|
|
 |
|
|
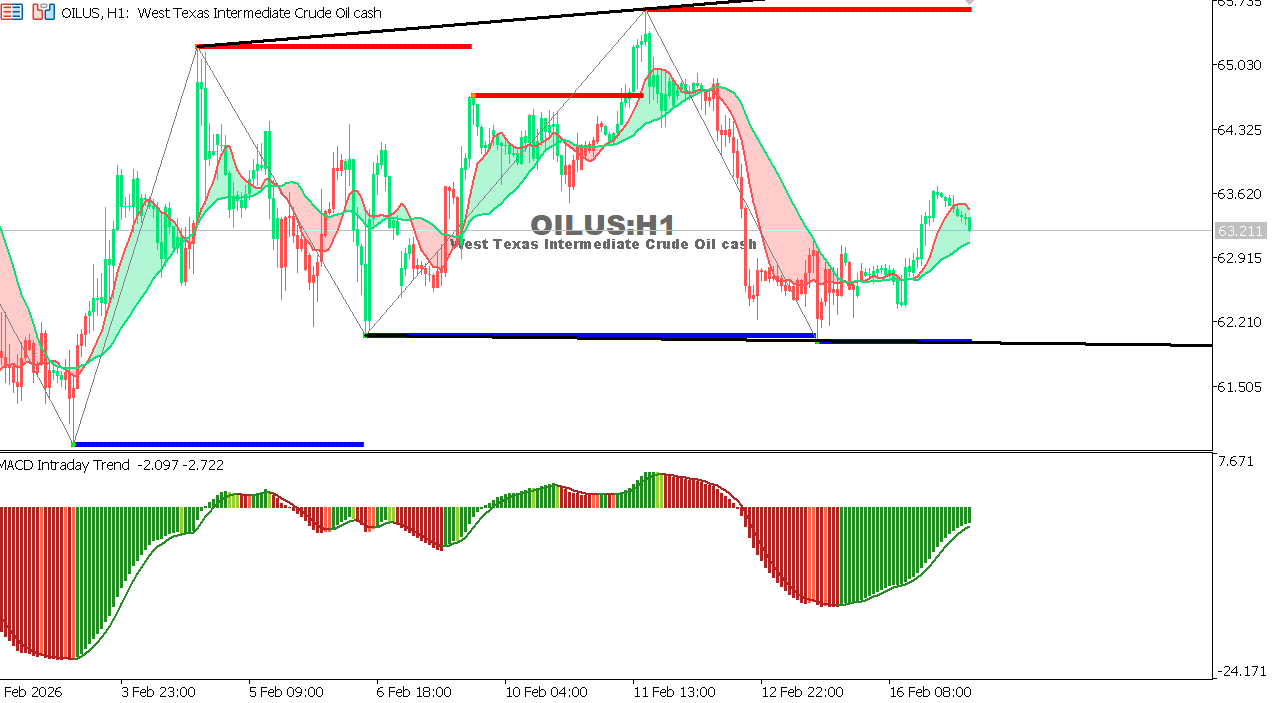 |
USOIL Chart on the hourly time frameOil is trading in a sideways-to-bearish range below 64.50, with visible momentum weakness. A break below 62.80 could open the door toward 61.50, while recovery above 64.50 is needed to confirm a temporary rebound. Overall Trend: Sideways to bearish Outlook: Trading below 64.50 keeps downside risks present.
|
 |
|
|
 |
|
|