FXEM - EMPIRE MARKETS - Company New Article
To access the website's classic version and the new accounts, please click here
Feb 12, 2026
 |
|
|
 |
|
|
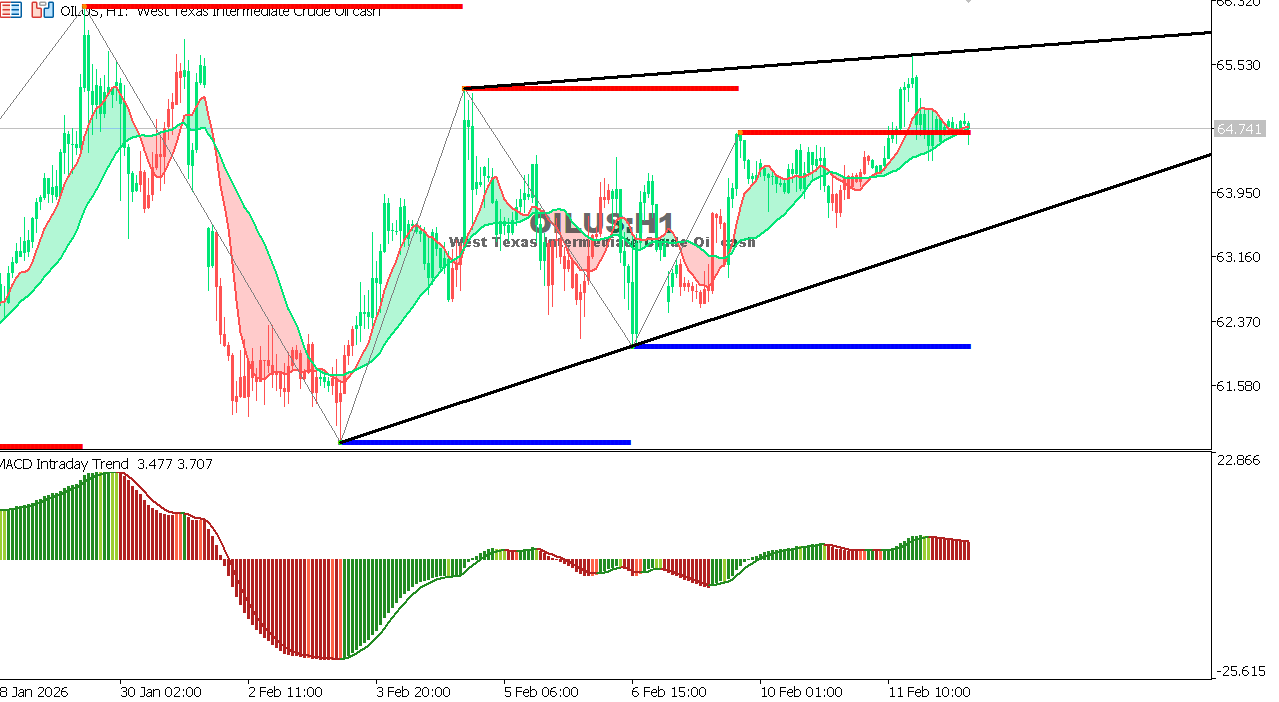 |
USOIL Chart on the hourly time frameOil is trading near 64.70 within a sideways range with a slight upward bias, supported by expectations of stable demand. A break above 66.00 would strengthen the upward move towards 67.50, while a break below 63.80 could bring renewed pressure towards 62.90. General Trend: Neutral with a slight upward bias Expectation: Sideways trading with a slight upside advantage.
|
 |
|
|
 |
|
|