FXEM - EMPIRE MARKETS - Company New Article
To access the website's classic version and the new accounts, please click here
Feb 11, 2026
 |
|
|
 |
|
|
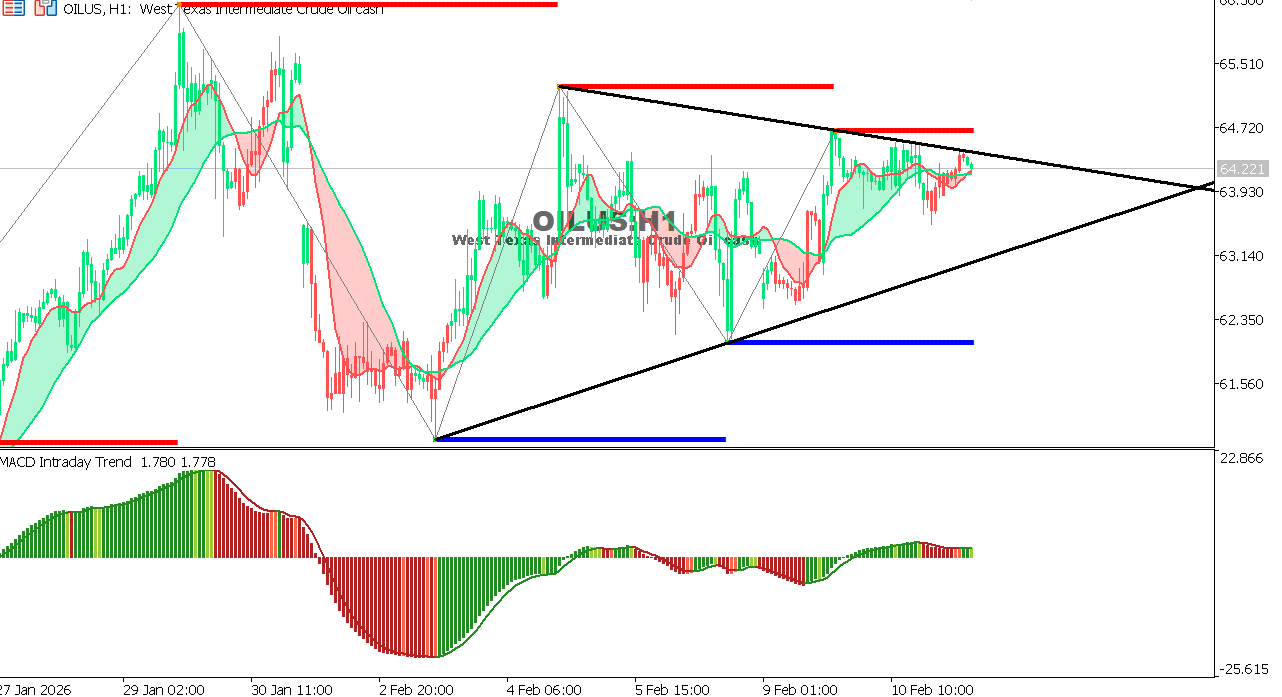 |
USOIL Chart on the hourly time frameOil is moving sideways between $63.50 and $65.00 with a slight upward bias. Momentum is relatively balanced, and markets are awaiting fresh catalysts from inventory data. A break above $65.00 could push towards $66.20, while a break below $63.50 would bring back downward pressure. Overall Trend: Sideways with an upward bias Expectation: The sideways range will continue until a strong catalyst emerges.
|
 |
|
|
 |
|
|