FXEM - EMPIRE MARKETS - Company New Article
To access the website's classic version and the new accounts, please click here
Feb 10, 2026
 |
|
|
 |
|
|
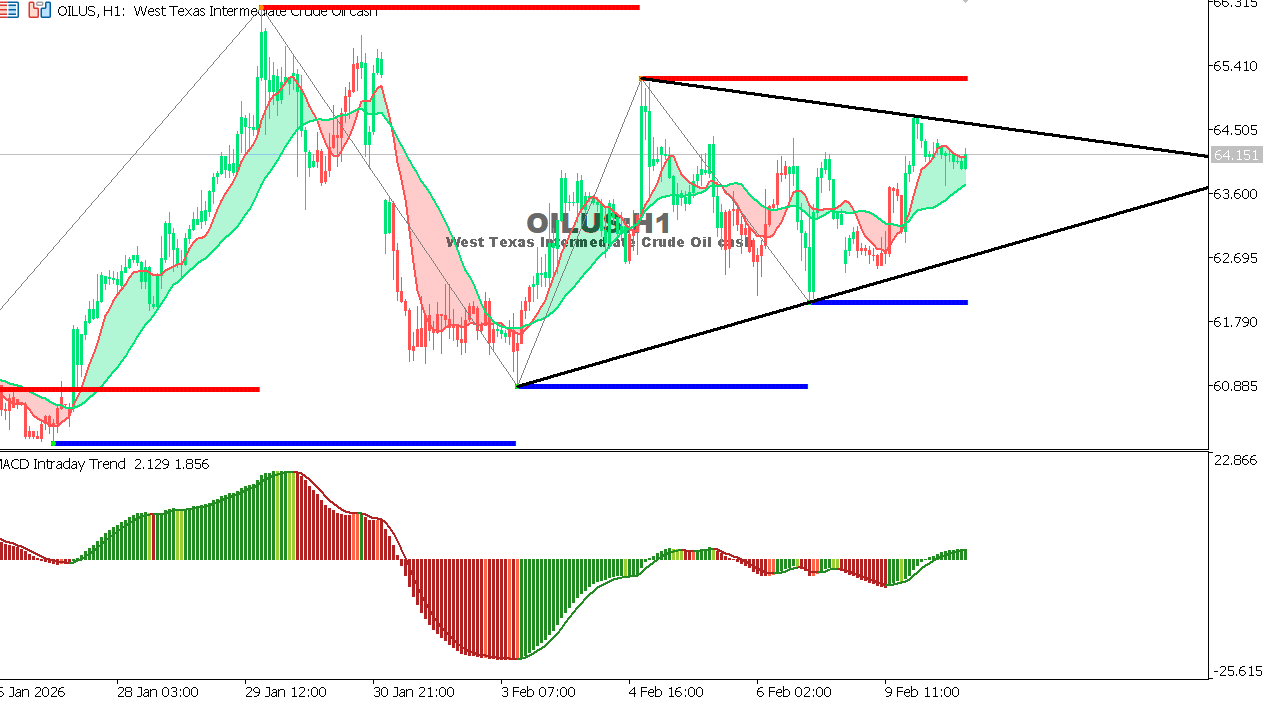 |
USOIL Chart on the hourly time frameOil is moving in a sideways range with an upward bias near $64.15, supported by expectations for this week's energy reports. Momentum is balanced, with a clear breakout needed to determine the next direction. General Trend: Neutral Expectation: A break above 65.30 strengthens the target of 66.00, while a break below 63.20 could push the price back towards 62.50.
|
 |
|
|
 |
|
|