FXEM - EMPIRE MARKETS - Company New Article
To access the website's classic version and the new accounts, please click here
Oct 31, 2025
 |
|
|
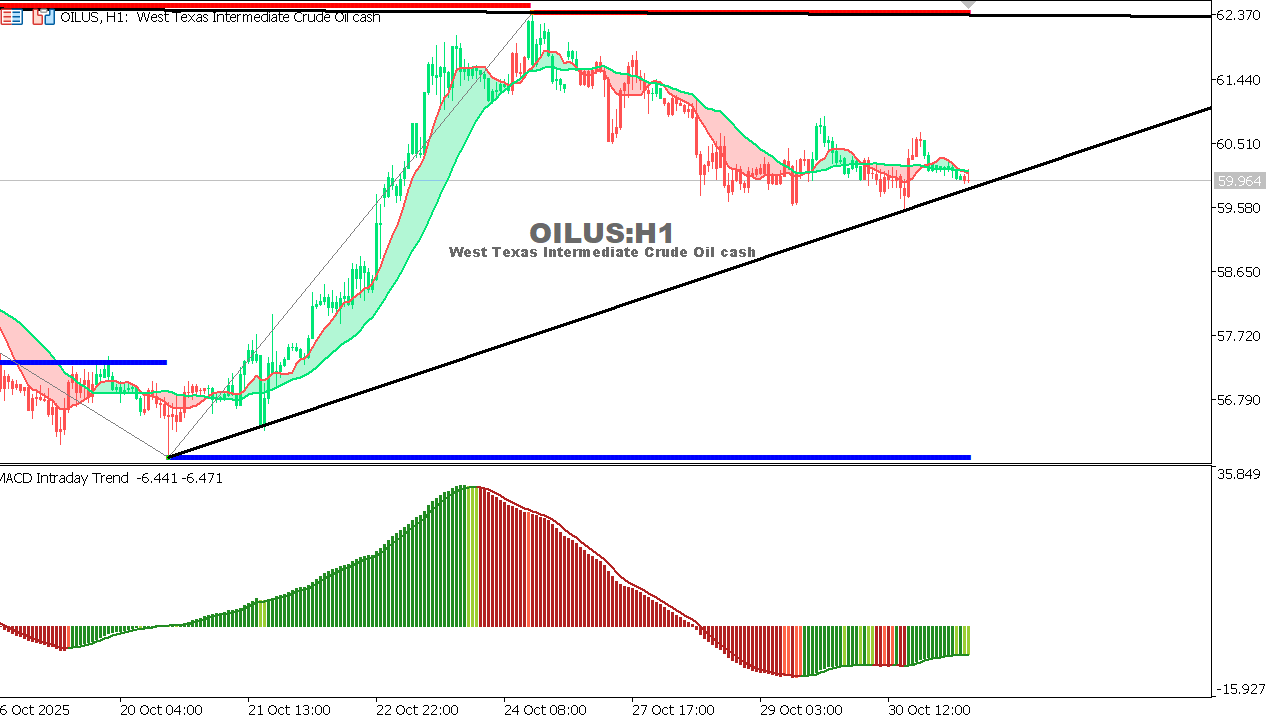 |
USOIL Chart on the hourtly time frameOverall Trend: Downward within a wide price channel. MACD indicator in negative territory with a tendency towards weakening downward momentum. Price below the moving average, but showing signs of an upward correction. Reasons: Expectation: |
 |
|
|
 |
|
|