FXEM - EMPIRE MARKETS - Company New Article
To access the website's classic version and the new accounts, please click here
Nov 03, 2025
 |
|
|
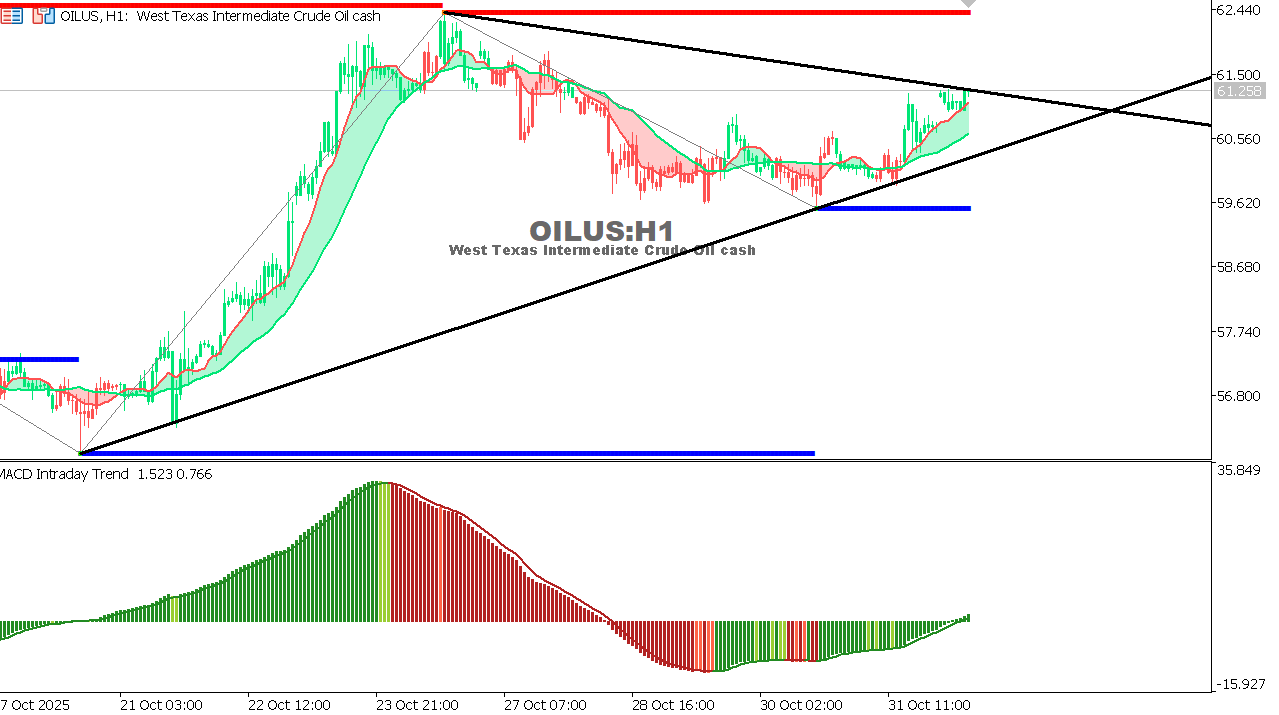 |
USOIL Chart on the hourtly time frameTrend: Bearish with sideways movement. Indicators: MACD negative; weak momentum; price under MA. Support/Resistance: 60.50 / 63.00 Reasons: Outlook: Below 60.50, price may reach 58.80; above 63.00, recovery toward 65.00 possible. |
 |
|
|
 |
|
|