FXEM - EMPIRE MARKETS - Company New Article
To access the website's classic version and the new accounts, please click here
Nov 21, 2025
 |
|
|
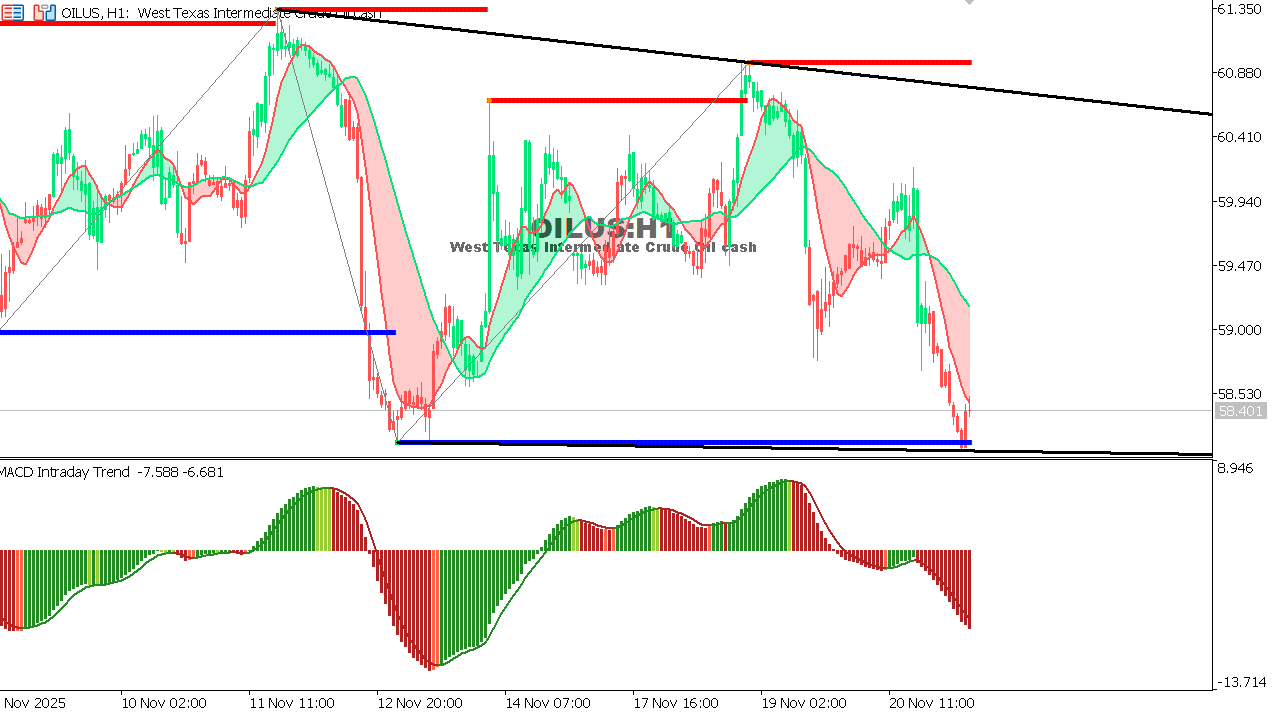 |
USOIL Chart on the hourly time frameOil trades near depressed levels after a strong bearish wave but is attempting to stabilize above key support around 57.80.
|
 |
|
|
 |
|
|