FXEM - EMPIRE MARKETS - Company New Article
To access the website's classic version and the new accounts, please click here
Mar 06, 2026
 |
|
|
 |
|
|
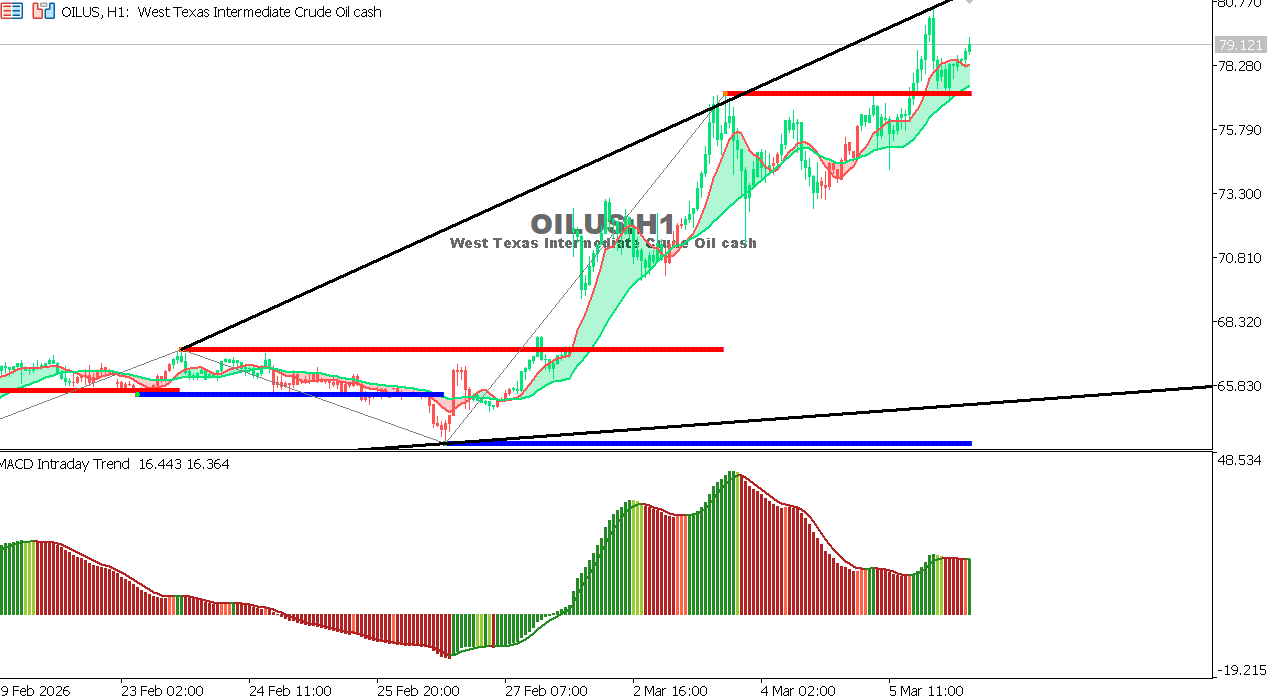 |
USOIL Chart on the hourly time frameOil is moving within a consolidation range after a previous rally, stabilizing near the $79 level. MACD momentum is gradually recovering, which could support another upward attempt if prices hold above the current support zone. Overall Trend: Neutral Outlook: A break above 80.50 could support a move toward 82.00, while a drop below 78.20 may trigger a deeper correction.
|
 |
|
|
 |
|
|