FXEM - EMPIRE MARKETS - Company New Article
To access the website's classic version and the new accounts, please click here
Mar 02, 2026
 |
|
|
 |
|
|
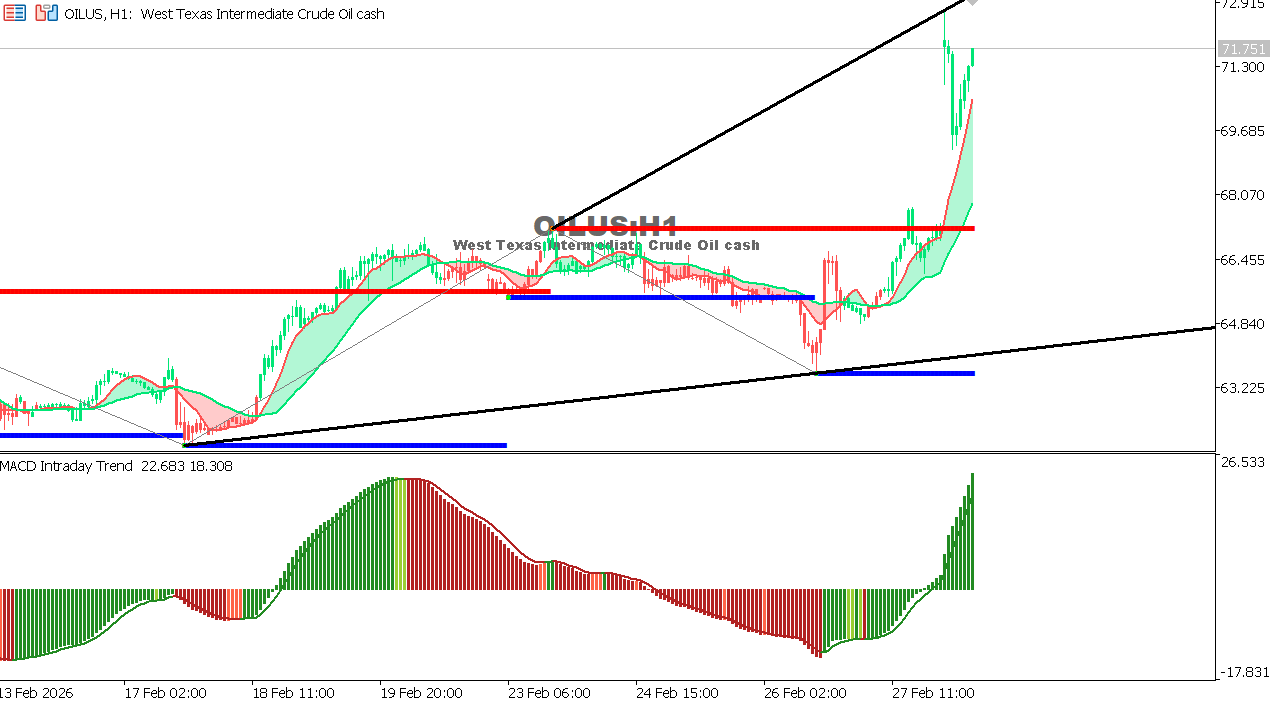 |
USOIL Chart on the hourly time frameOil is witnessing sharp gains due to fears of supply disruptions in the Gulf region, particularly with strikes targeting areas near critical energy corridors. Price is moving in a strong impulsive wave with accelerating positive MACD momentum. Overall Trend: Bullish Outlook: Continued tensions support further upside, while any sudden de-escalation could trigger a rapid bearish correction.
|
 |
|
|
 |
|
|