FXEM - EMPIRE MARKETS - Company New Article
To access the website's classic version and the new accounts, please click here
Dec 04, 2025
 |
|
|
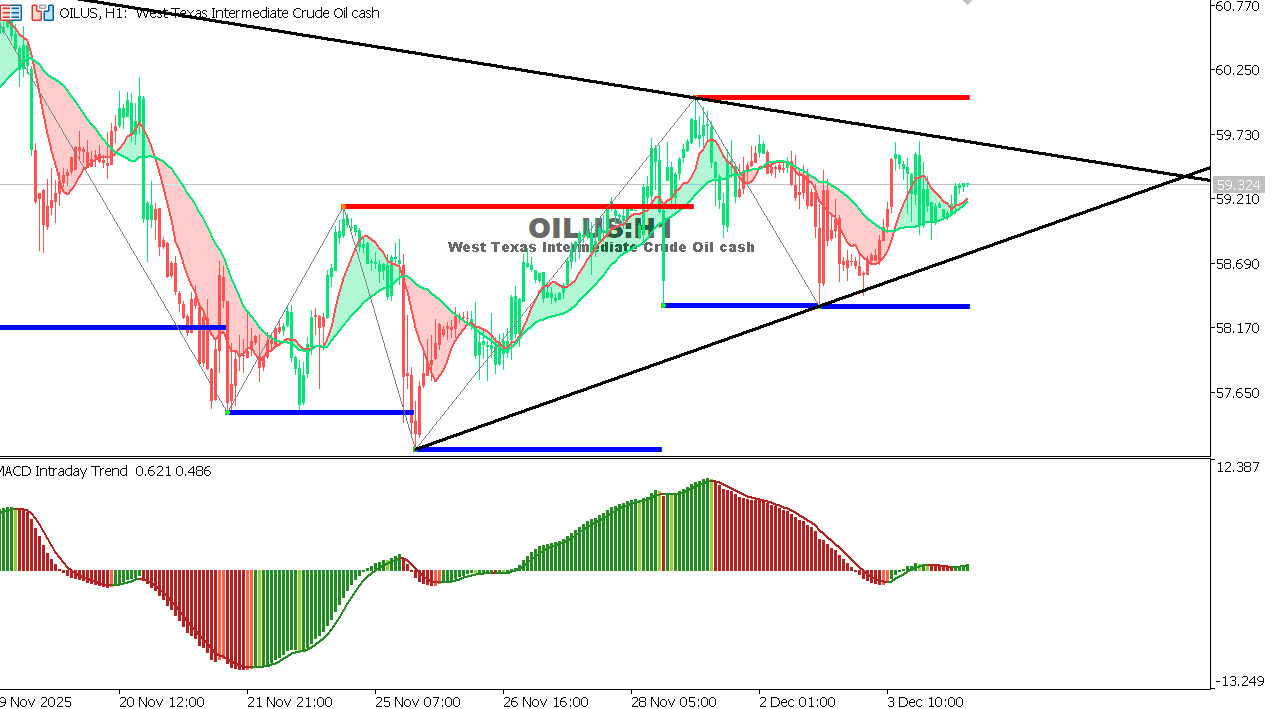 |
USOIL Chart on the hourly time frameOil is trading at 59.32 after a sharp sell-off triggered by a surprise increase in US inventories. The price is currently near a key support zone at 58.70. The MACD indicator shows a slowdown in the decline, which may indicate the beginning of a temporary bottom formation. Any bounce above 59.80 would strengthen the likelihood of an upward move towards 60.50. Overall trend: Short-term bearish Expectation: A limited bounce is possible as long as support holds; a break would bring renewed pressure towards 57.90. |
 |
|
|
 |
|
|