FXEM - EMPIRE MARKETS - Company New Article

To access the website's classic version and the new accounts, please click here

Dec 03, 2025

XAU/USD chart on the hourly time frame

XAU/USD chart on the hourly time frame

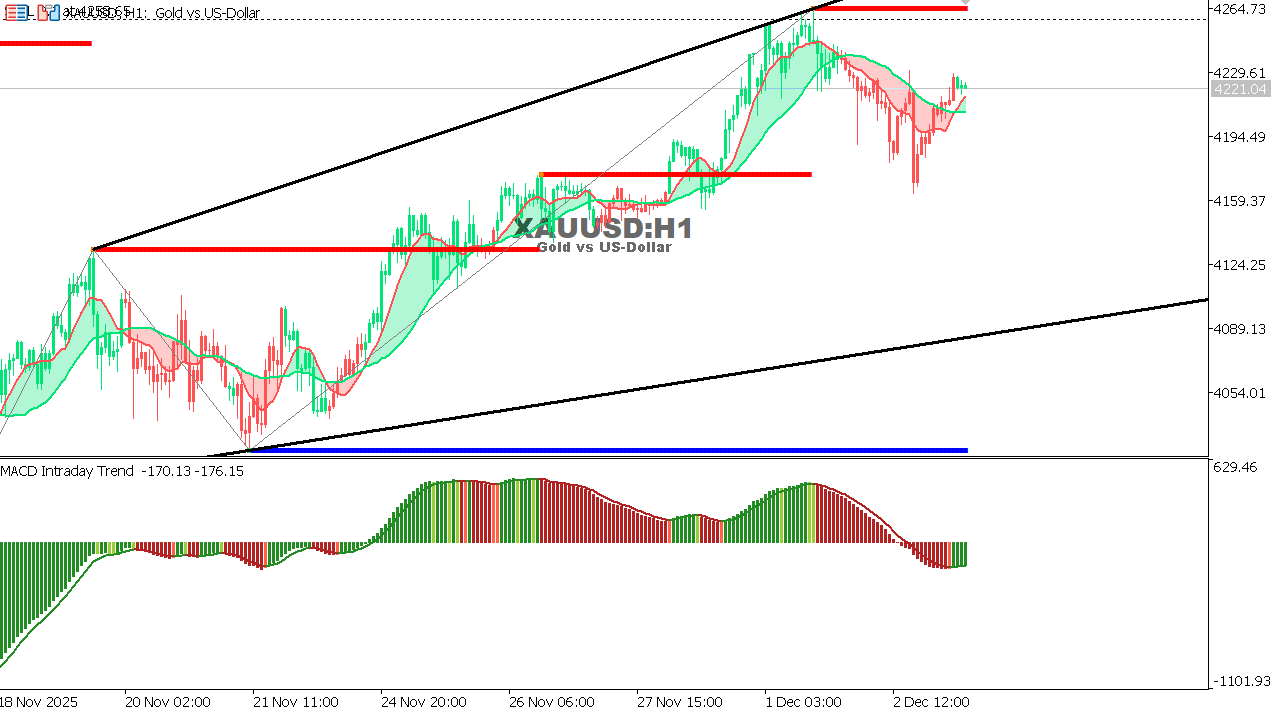
Gold is showing a clear rebound from the lows near 4100 and is now trading around 4221-4230 within a broad ascending channel, benefiting from a weakening dollar and a moderate return of safe-haven demand.

The price managed to hold above the pivotal support zone of 4170, giving a boost to the current upward movement.

However, the move remains relatively weak below the short-term resistance at 4250. The MACD indicator is still in negative territory, but the downward momentum is starting to weaken with the first signs of a positive crossover on the shorter timeframes.

This supports the possibility of a continued recovery as long as the price remains above 4170.

General trend: Neutral with a slight upward bias within an ascending channel.
Support: 4170 – 4125 – 4085
Resistance: 4250 – 4290 – 4320

Expectation:
A break above 4250 would reinforce the upward trajectory towards 4290 and then 4320.
Conversely, a failure to break through the resistance and a return of selling pressure could push the price back towards 4170, a crucial support zone for the trend.


USOIL Chart on the hourtly time frame

USOIL Chart on the hourly time frame

Oil prices are under continuous selling pressure near 58.75 due to concerns about global demand, despite some limited attempts at recovery. The overall momentum is weakening, and the MACD indicator shows that negative pressures persist.

Overall trend: Downward
Support: 58.20 – 57.40
Resistance: 59.60 – 60.30

Expectation:
The decline may continue towards 58.20 unless the price breaks above 59.60, which would be the first indication of a short-term technical recovery.
 

USTEC chart on the hourly time frame

USTEC chart on the hourly time frame

The index continues its ascent towards new highs, driven by technology stocks, despite some minor signs of slowing momentum.

The overall trend is strongly bullish.
General Trend: Upward
Support: 25480 – 25290
Resistance: 25850 – 26000

Expectation:
A break above 25850 could push the index towards 26000, while any decline will remain limited above 25480.
 

US30 chart on the hourly time frame

US30 chart on the hourly time frame

The index is moving in a strong upward trend, achieving consecutive highs, supported by declining bond yields and a calmer dollar.

The overall momentum is positive despite the index approaching technical overbought territory.

General Trend: Upward
Support: 47380 – 47090
Resistance: 47850 – 48000

Expectation:
We expect the upward movement to continue towards 47850 unless it breaks below 47380, in which case only a limited correction will begin.
 

- A look at yesterday report dated Dec 2, 2025.

To open Live account click here 

One Trading Account | 50+ Forex Pairs | 80+ Trading Instruments
Multi-Asset Trading Platforms

Cookie Policy
This website uses cookies to ensure you get the best experience on our website. We use cookies for proper website navigation and function and for statistical and analytical purposes. You can select the cookie categories that you would like to manage through the Cookies Settings at any time. Please configure your Cookies Settings before proceeding. To learn more, please read our Cookies Policy