FXEM - EMPIRE MARKETS - Company New Article
To access the website's classic version and the new accounts, please click here
Apr 01, 2026
Technical analysis of some commodities pairs:
Technical Analysis Report (April 1, 2026):
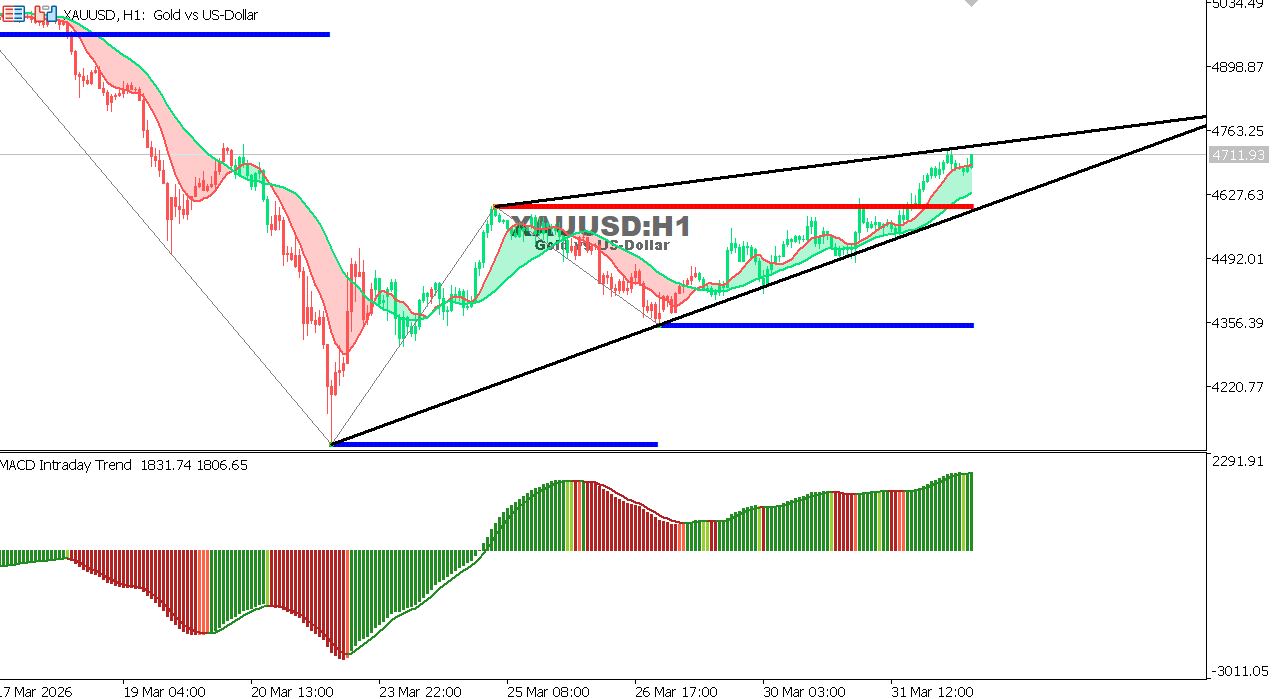
XAUUSD Hourly Chart
Gold continues its strong upward movement, reaching 4711.93 and surpassing previous resistance levels. This confirms the continuation of the bullish trend, supported by strong momentum on the MACD indicator. However, some profit-taking may occur after this rise. Holding above 4680 supports further upward movement towards higher levels.
Overall trend: Bullish
- Support: 4680 – 4620
- Resistance: 4750 – 4800
Expectation: The bullish trend continues with the possibility of a limited correction.
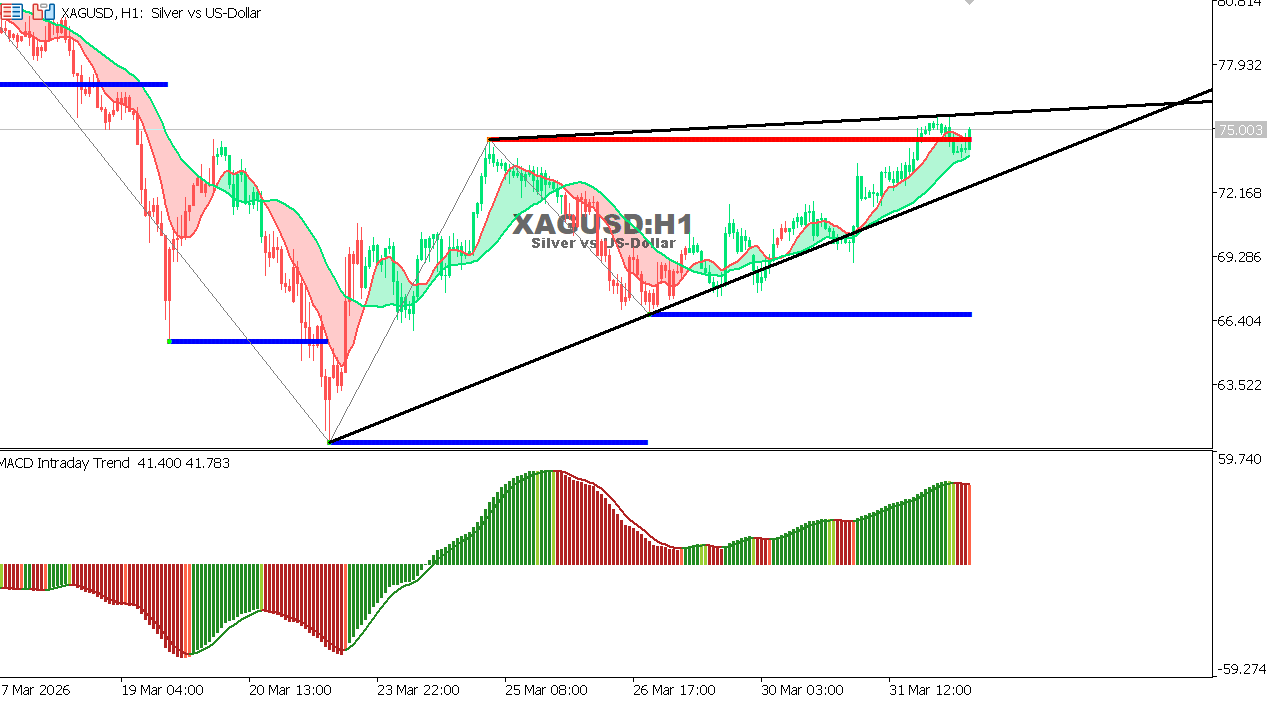
XAGUSD Hourly Chart
Silver continues its positive performance and is trading near 75.00, supported by clear upward momentum, while continuing to trade above strong support levels. A break above 76.00 could push towards 78.00, while a break below 73.80 could lead to a correction.
Overall trend: Upward
- Support: 73.80 – 72.50
- Resistance: 76.00 – 78.00
Expectation: Continued upward movement, with close resistance being monitored.
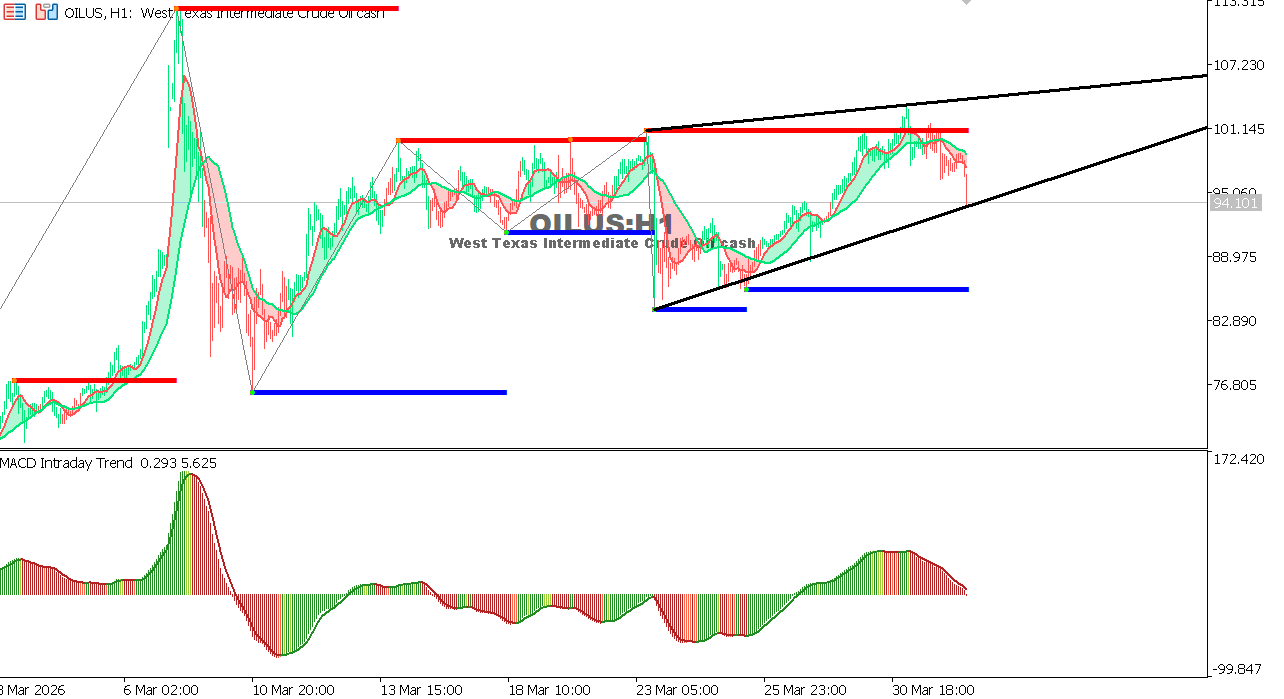
USOIL Hourly Chart
Oil is trading near 94.10 after retreating from higher levels, with relative momentum showing signs of weakness. The MACD indicator is trending negative, which may indicate continued short-term selling pressure. A break below 93.00 could open the door for further declines.
Overall Trend: Corrective Bearish
- Support: 93.00 – 91.50
- Resistance: 95.50 – 97.00
Expectation: Continued selling pressure with a potential for a limited rebound.
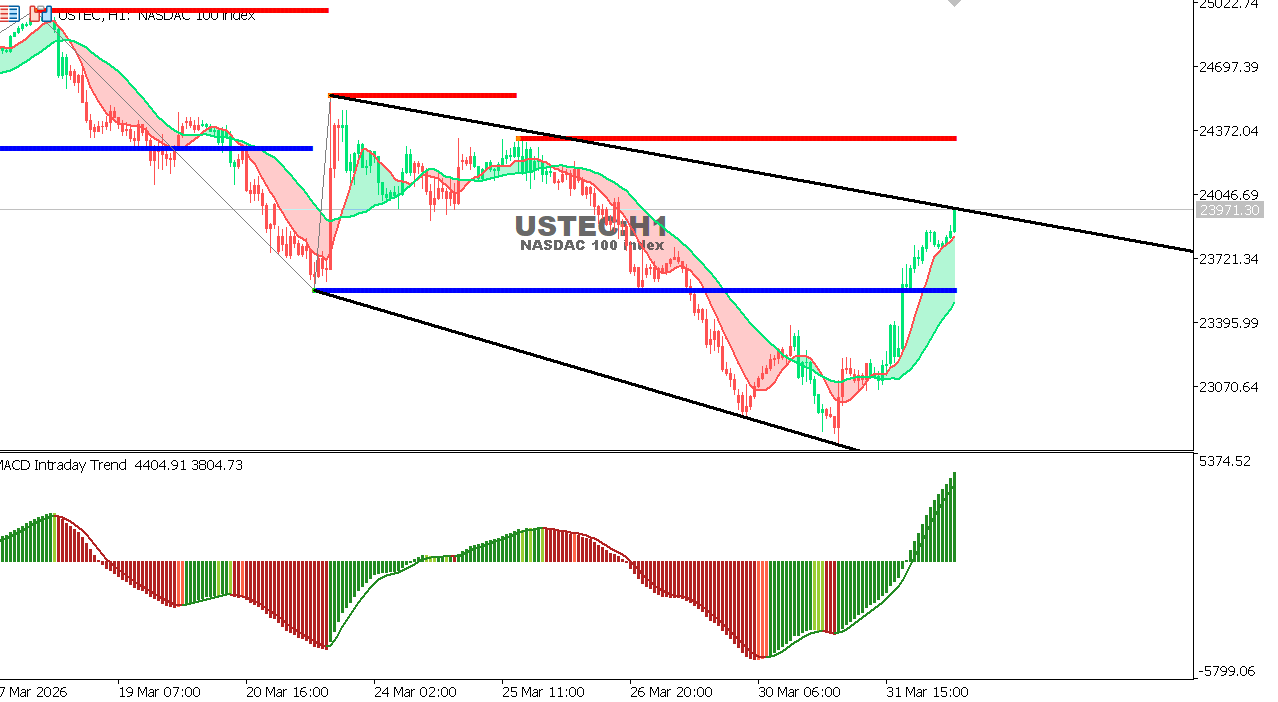
USTEC Hourly Chart
The Nasdaq continues its strong upward trend, reaching 23,971.30, supported by strong positive momentum. The uptrend remains unchanged, with no clear signs of weakness so far.
Overall Trend: Upward
- Support: 23,650 – 23,300
- Resistance: 24,200 – 24,500
Expectation: Continued upward movement with the possibility of limited profit-taking.
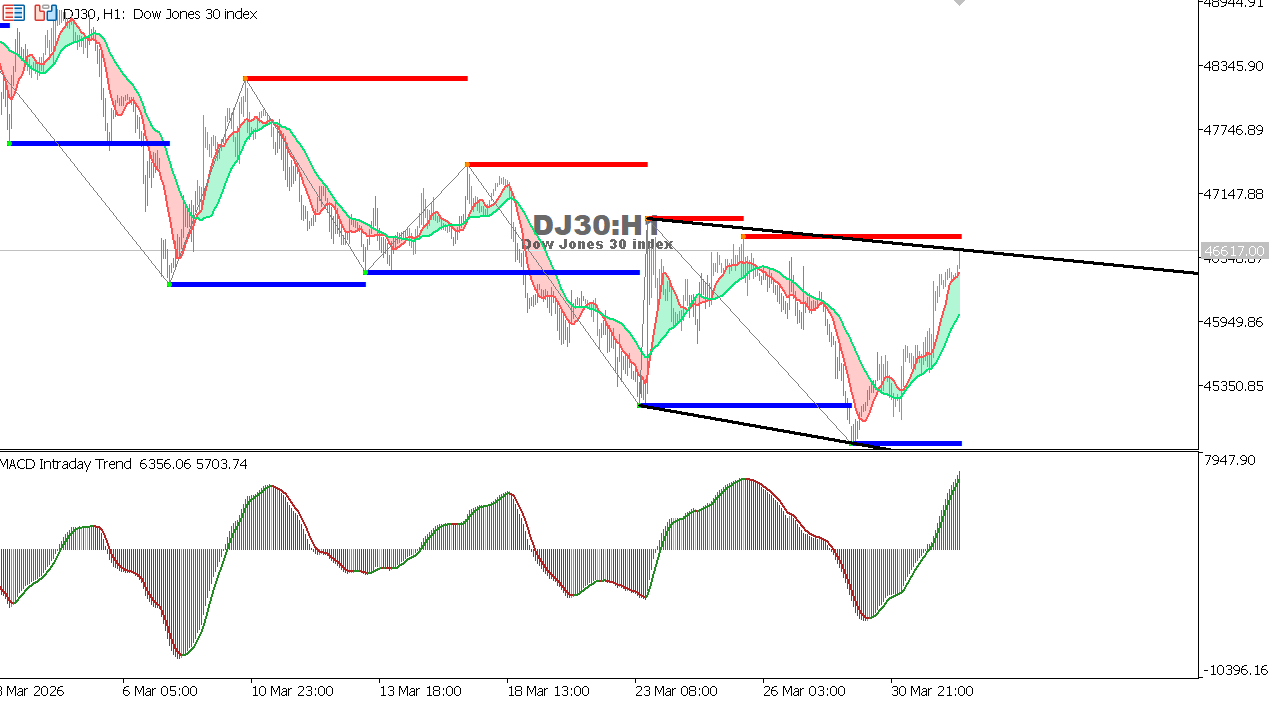
US30 Hourly Chart
The Dow Jones is trading at 46,617.00, continuing its upward trend, supported by strong stock performance, although some fluctuations are possible near the highs.
Overall Trend: Upward
- Support: 46,200 – 45,800
- Resistance: 46,800 – 47,200
Expectation: The upward trend continues, with price action at resistance levels being closely monitored.