FXEM - EMPIRE MARKETS - Company New Article
To access the website's classic version and the new accounts, please click here
Mar 31, 2026
 |
|
|
 |
|
|
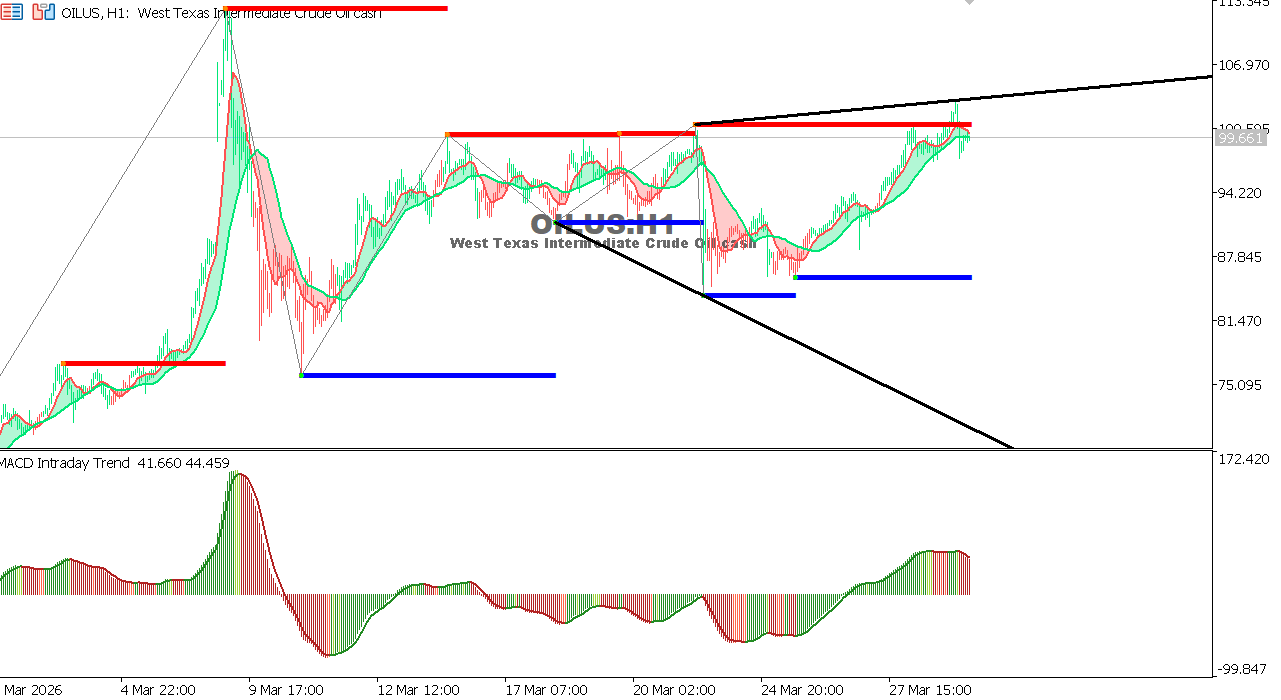 |
USOIL Chart on the hourly time frameOil is trading near highs around 99.66 after a strong rally, with momentum slowing. The MACD indicator remains positive but suggests a potential short-term correction. Holding above 98.50 supports the continuation of the uptrend, while a break below this level could push towards 96.50. Overall Trend: Upward Support: 98.50 – 96.50 Resistance: 101.00 – 103.00 Expectation: Continued upward trend with a limited correction possible.
|
 |
|
|
 |
|
|