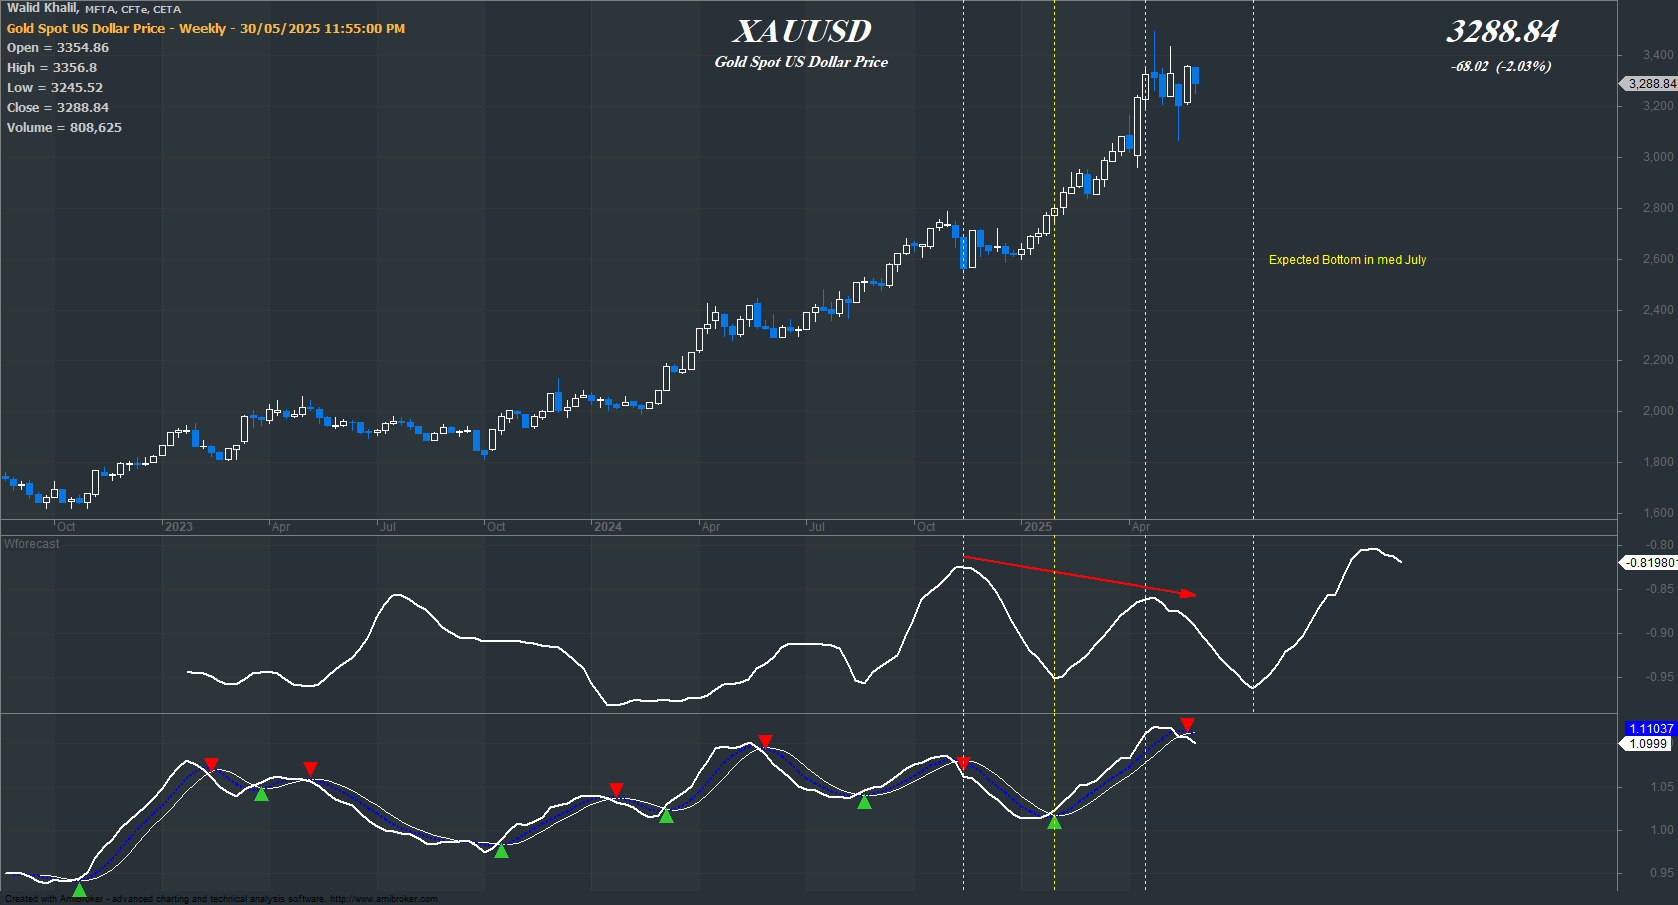
XAU/USD chart on the weekly time frame
The weekly chart above displays the price action of Gold, accompanied by two proprietary technical indicators.
The middle panel features our forecasting oscillator, which anticipates future price movements, while the lower panel incorporates a trend-following indicator that generates buy and sell signals based on a confluence of moving averages.
Our forecasting model currently projects a notable downward trajectory, with a potential cyclical low expected to materialize by mid-July, which could mark a key reversal zone.
Supporting this outlook, the trend indicator in the lower panel has recently triggered a fresh weekly sell signal, reinforcing the bearish bias.
In light of this technical alignment, we assign a short recommendation for XAU/USD, targeting a downside objective between $2,900–$3,000.
A stop-loss is advised at $3,450 to mitigate risk exposure.