FXEM - EMPIRE MARKETS - Company New Article
To access the website's classic version and the new accounts, please click here
Mar 11, 2026
US Oil Pulls Back After Reaching $112
Crude prices volatile amid economic data and demand shifts
|
Prices of West Texas Intermediate (US crude oil) experienced notable volatility during recent trading sessions. The market climbed to a high near $112.55 per barrel before entering a corrective move that pushed prices back below the $90 level. |
 |
This sharp movement reflects the current uncertainty in energy markets, as investors respond to a combination of factors including global demand expectations, geopolitical developments, and the influence of US economic data on the US dollar.
Stronger US economic data or a rising dollar can often put pressure on commodities priced in dollars, including crude oil. In addition, profit-taking after a strong rally can accelerate short-term corrections.
From a technical perspective, the recent price action suggests that the market has entered a corrective phase following a strong bullish trend, with oil attempting to stabilize near key support levels that could determine the next market direction.
At the same time, economic data releases continue to play an important role in market volatility. Traders typically focus on the market consensus (or forecast), which represents what analysts expect before the data is released.
Market reactions often depend on the difference between the actual figure and the forecast; the larger the gap, the stronger the potential market reaction. In addition, revisions to the previous data (prior) can also influence price movements.
Traders also remain cautious around economic releases because spreads can widen significantly at the moment of release, which is why many prefer waiting for a quick price retest before entering the market.
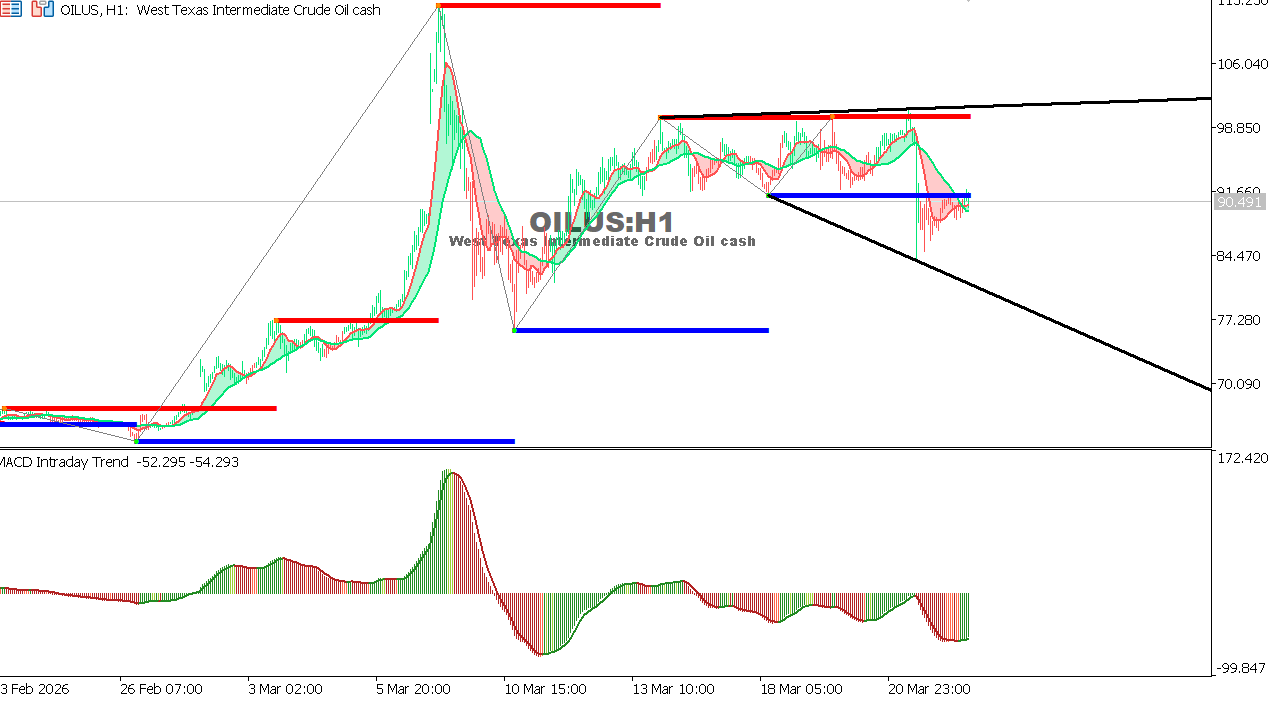
Technical Outlook for US Oil (WTI) – H1 Timeframe
The chart shows that West Texas Intermediate crude oil has started to recover after a sharp decline from the recent peak near $112.55. Prices are currently trading around $85.45, attempting to stabilize after the corrective move.
From a technical perspective, the price action is forming a symmetrical triangle pattern, created by the converging trendlines. This pattern usually reflects a period of market consolidation before a potential breakout in either direction.
The MACD indicator also shows early signs of positive momentum, as the histogram begins to shift from negative to positive territory, suggesting that buying pressure is gradually returning.
- Key Support: around $77.20, near the lower boundary of the triangle, which could act as a strong support zone if prices decline again.
- Key Resistance: the upper descending trendline near $90–$92. A breakout above this level could open the door for further gains toward $100 or higher.
Overall, the current movement appears to be a corrective consolidation within a broader bullish structure, with traders closely watching the triangle breakout to determine the next major direction in the oil market.