FXEM - EMPIRE MARKETS - Company New Article
To access the website's classic version and the new accounts, please click here
Oct 03, 2025
 |
|
|
 |
||
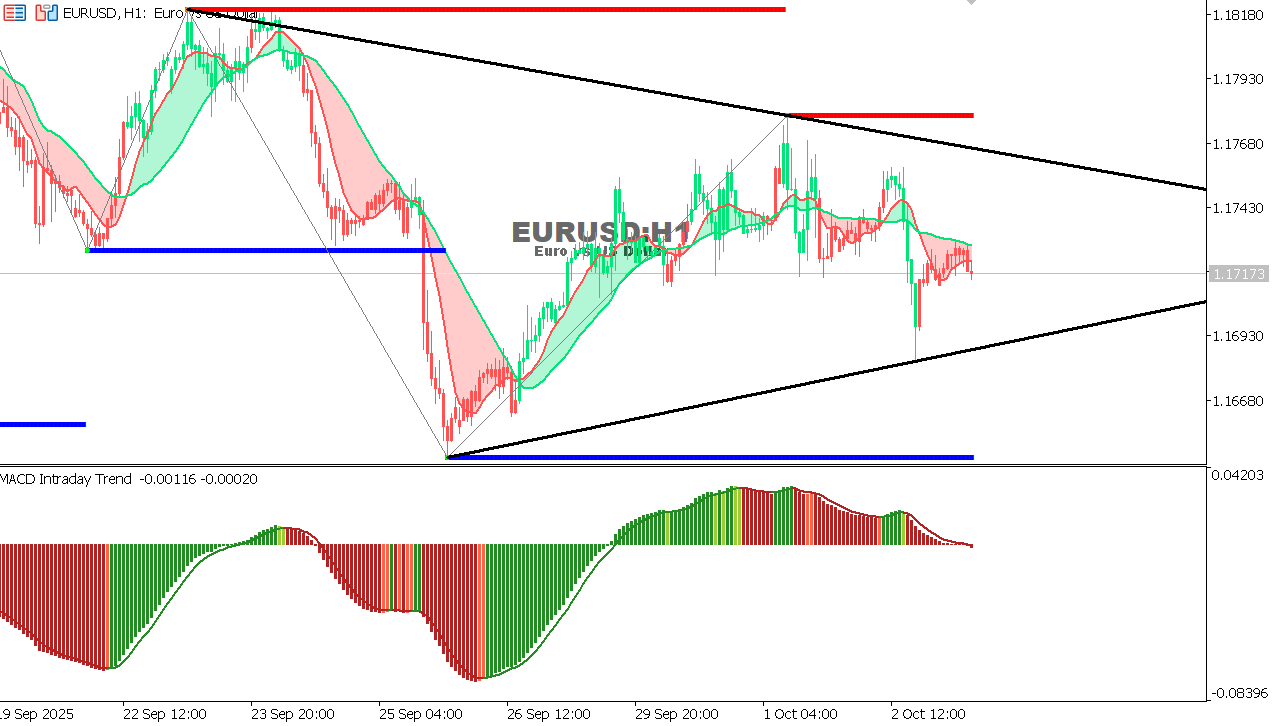
EUR/USD Chart on the hourtly time frameThe pair trades near 1.1717 within a symmetrical triangle.
|