FXEM - EMPIRE MARKETS - Company New Article
To access the website's classic version and the new accounts, please click here
Jul 09, 2025
 |
|
|
 |
||
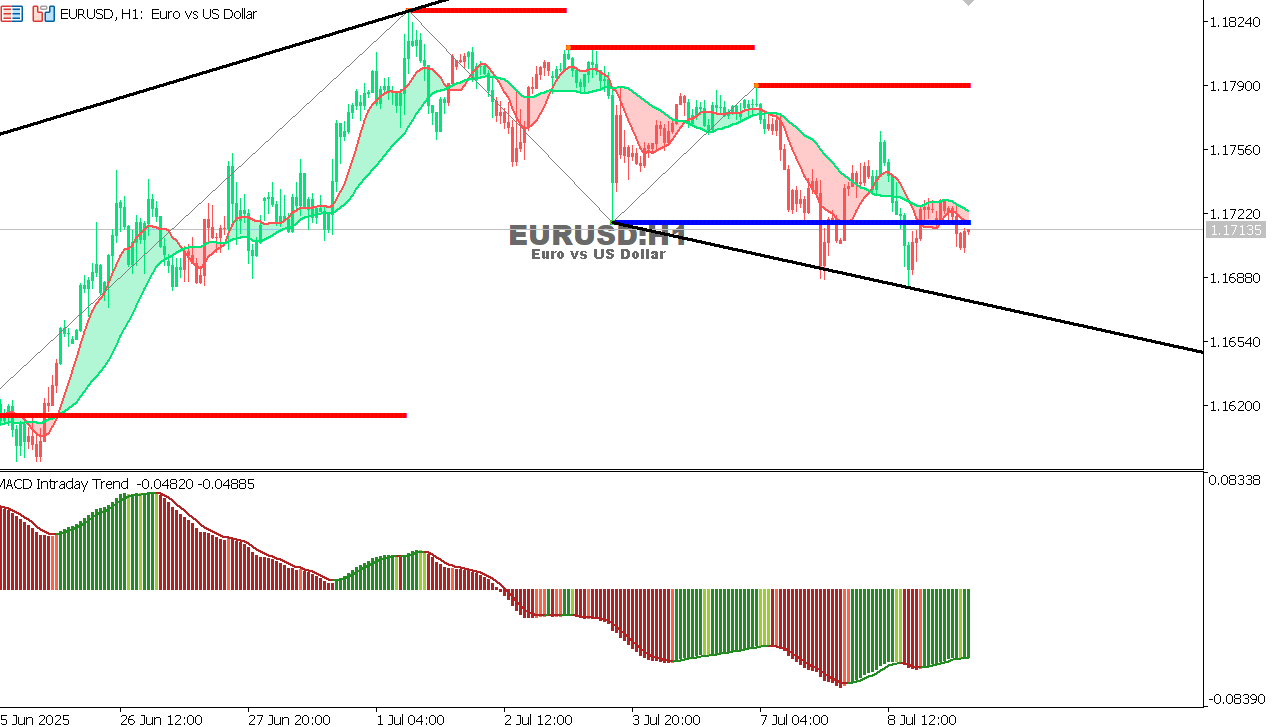
EUR/USD Chart on the hourtly time frameCurrent situation: The pair rebounded from the resistance level of 1.1725 and failed to break it several times.
|