FXEM - EMPIRE MARKETS - Company New Article
To access the website's classic version and the new accounts, please click here
Jul 01, 2025
 |
|
|
 |
||
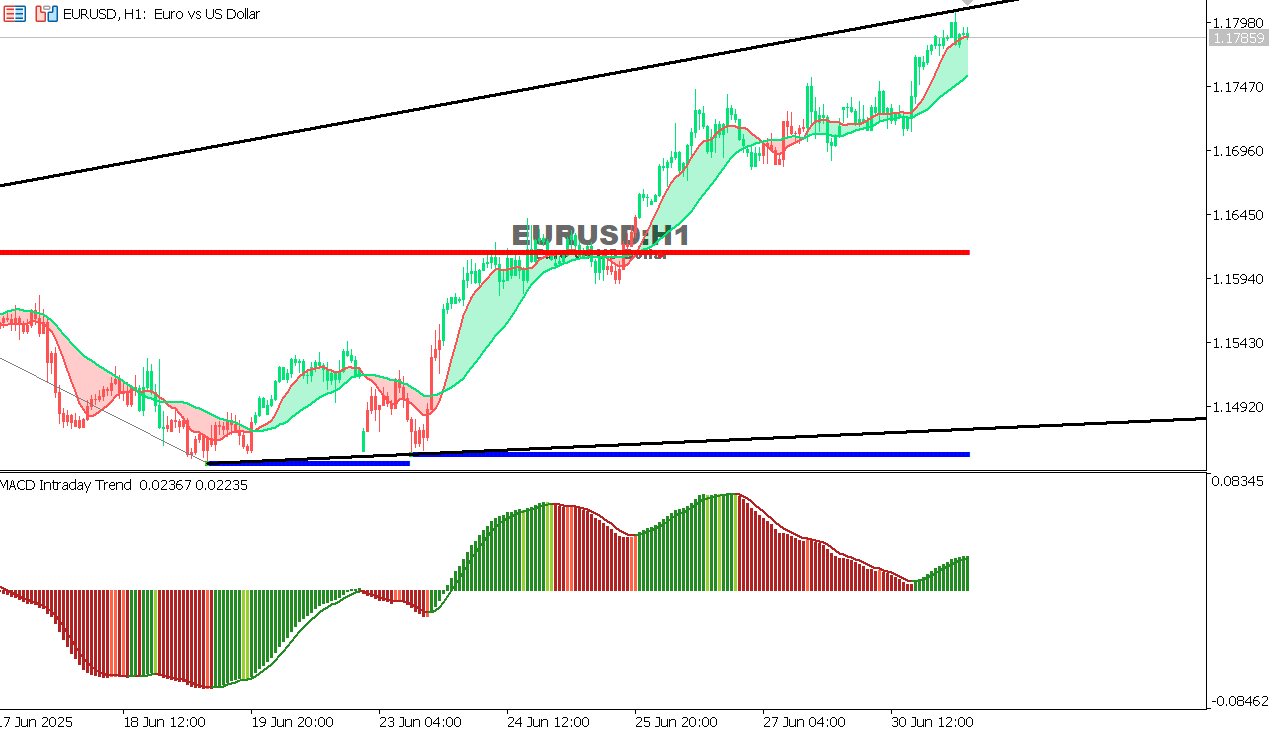
EUR/USD Chart on the hourtly time frameCurrent Trend: Strong Upward Indicators: The price has broken the resistance at 1.1610 and is trading near the ceiling of the ascending channel, with clear positive momentum on the MACD. Expectation: Continuation of the rise towards 1.1820 provided it holds above 1.1740. Support and Resistance Levels:
|
|
|