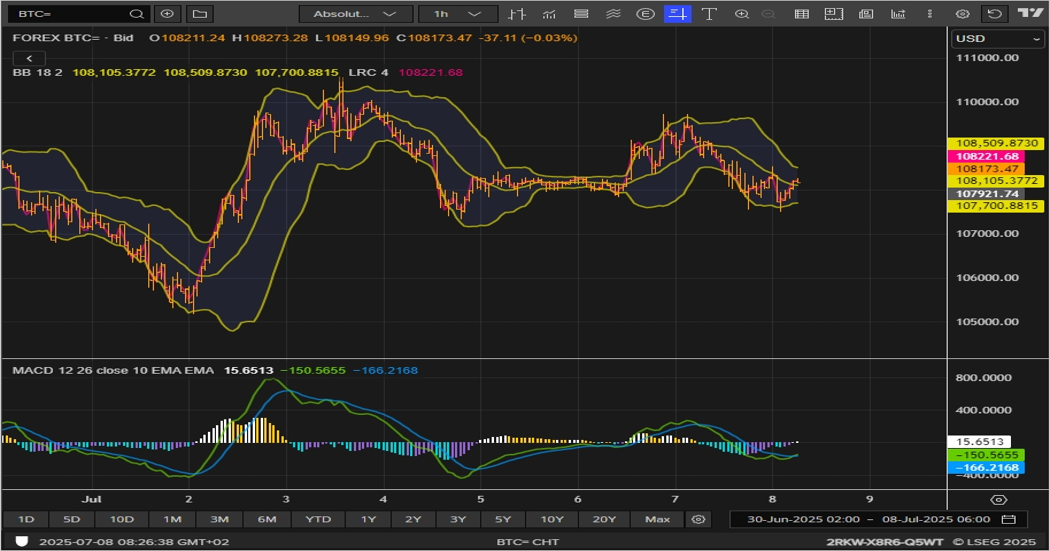
Previously, we wrote; “BTC managed to find some support and pull-back form the 107.60K level, and rebounded back, approaching the key 110.5K resistance level.”
BTC found resistance once more at (109.5 – 110.5)K range, and fall bac towards the 107.6K support once more.
Currently, we see a rebound from the 107.6K level and we expect another attempt to re-test the key resistance range at (109.5 – 110.5)K range once more.
This website uses cookies to ensure you get the best experience on our website. We use cookies for proper website navigation and function and for statistical and analytical purposes. You can select the cookie categories that you would like to manage through the Cookies Settings at any time. Please configure your Cookies Settings before proceeding. To learn more, please read our Cookies Policy
We use cookies to ensure the best possible experience as a guest in our site. Please configure your cookies settings before proceeding.
Necessary
Always active
These cookies are strictly necessary to enable you to move about the website and to provide certain features you have requested. There is no need for consent for the use of such cookies.