FXEM - EMPIRE MARKETS - Company New Article

To access the website's classic version and the new accounts, please click here

May 14, 2025
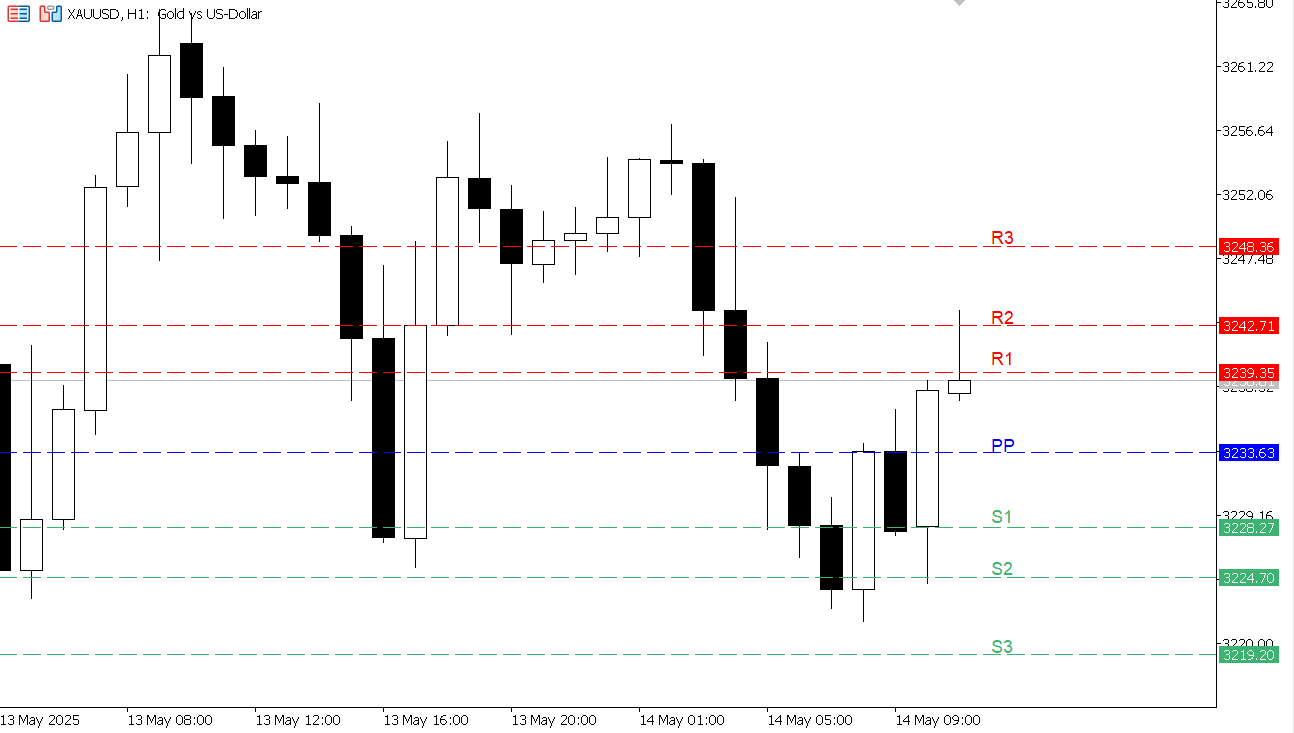
XAU/USD chart on the hourly time frame

XAU/USD chart on the hourly time frame

After a strong upward trend that brought prices near the 3380 level last week, gold has begun a gradual correction amid a slight improvement in global risk appetite. Current prices indicate a temporary equilibrium, and we may see movement between 3220 and 3270 in the coming sessions, as investors await further signals regarding US inflation and the path of interest rates.
 
Resistance 3 Resistance 2 Resistance 1 Pivot Point Support 1 Support 2 Support 3
3248.36
3242.71
3239.35
3233.63
3228.27
3224.70
3219.20

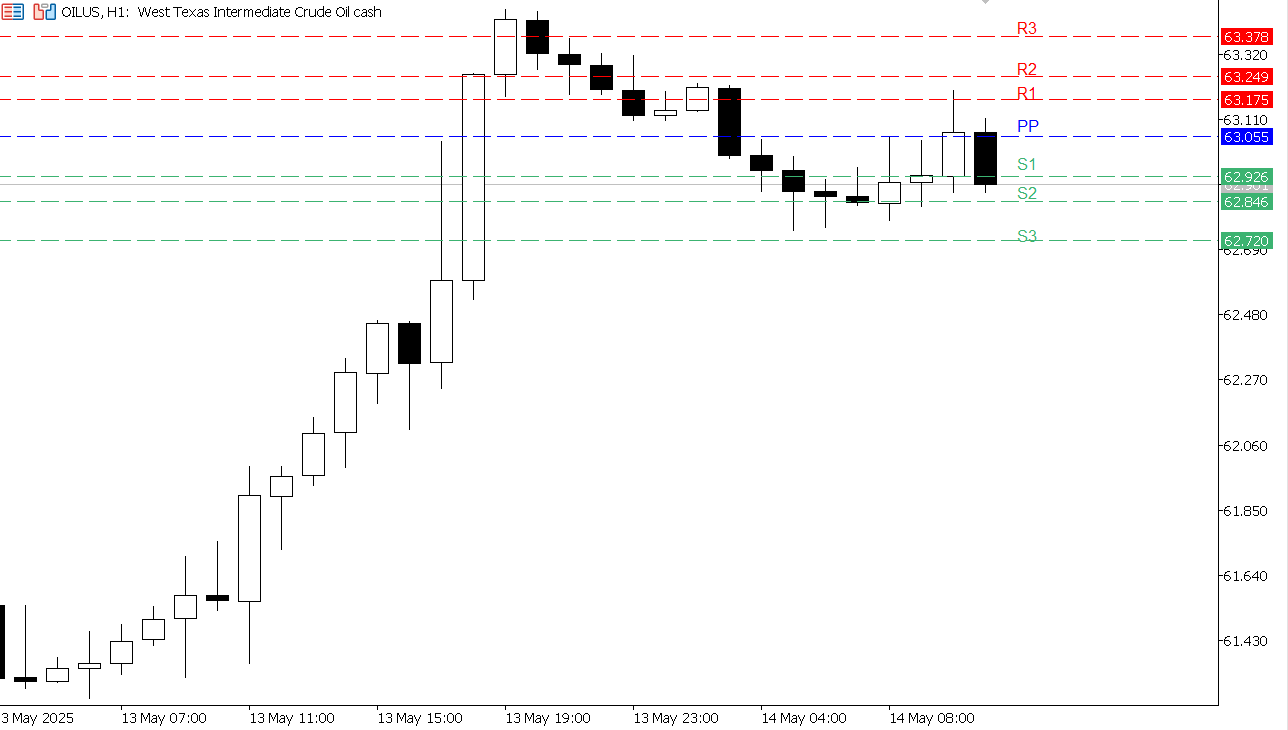
USOIL chart on the hourly time frame

USOIL chart on the hourly time frame

Oil prices rose significantly, benefiting from data indicating a decline in US inventories, in addition to stable expectations for demand growth in the second half of the year. Continued trading above $62 reflects temporary optimism in the market, with a potential move towards $64.20 this week, provided there are no negative signals from OPEC+ or economic data.
 
Resistance 3 Resistance 2 Resistance 1 Pivot Point Support 1 Support 2 Support 3
62.275
62.195
62.144
63.055
61.978
61.928
61.845

One Trading Account | 50+ Forex Pairs | 80+ Trading Instruments
Multi-Asset Trading Platforms

Cookie Policy
This website uses cookies to ensure you get the best experience on our website. We use cookies for proper website navigation and function and for statistical and analytical purposes. You can select the cookie categories that you would like to manage through the Cookies Settings at any time. Please configure your Cookies Settings before proceeding. To learn more, please read our Cookies Policy