FXEM - EMPIRE MARKETS - Company New Article

To access the website's classic version and the new accounts, please click here

Jul 30, 2025
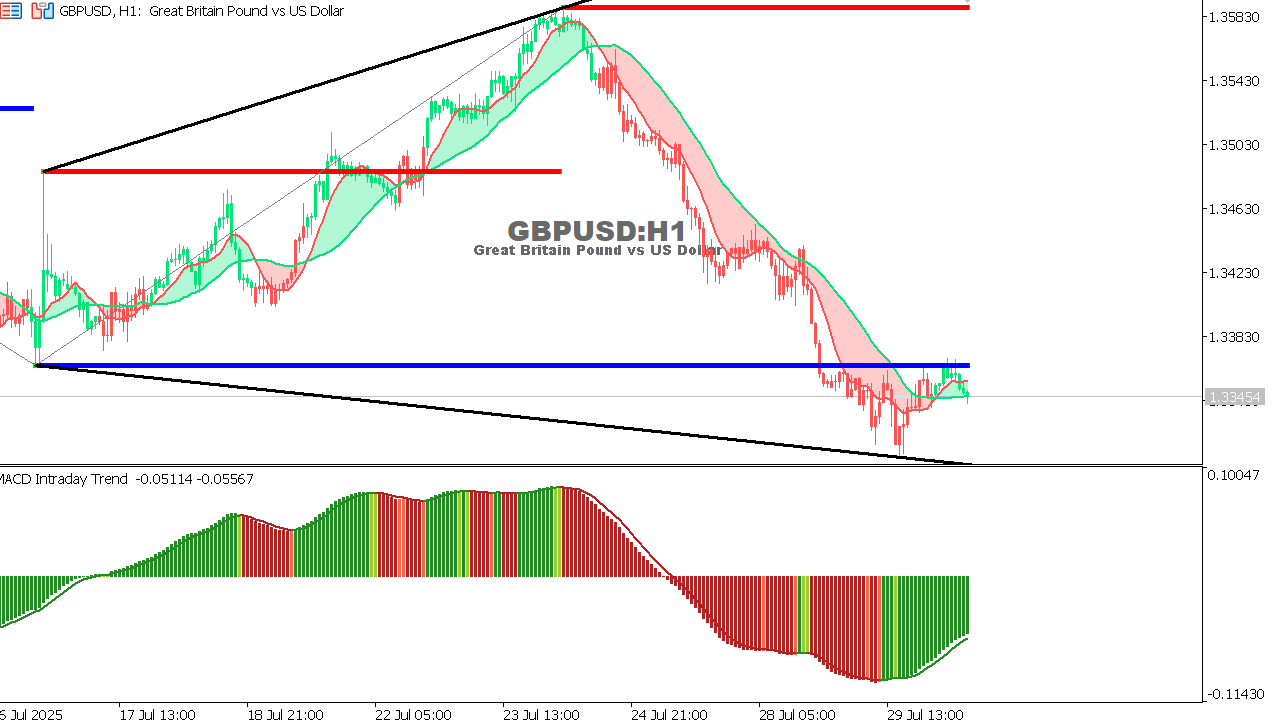
GBP/USD chart on the hourly time frame

GBP/USD chart on the hourly time frame

  • Current trend: Bearish
  • Technical situation: Clear horizontal support has been broken and the price is attempting to consolidate below it.
  • MACD: Starting to catch its breath after a long downward trend.
  • Expectation: As long as the price is no longer above the 1.3380 resistance, the likely trend is to continue the decline towards 1.3300 and then 1.3250.


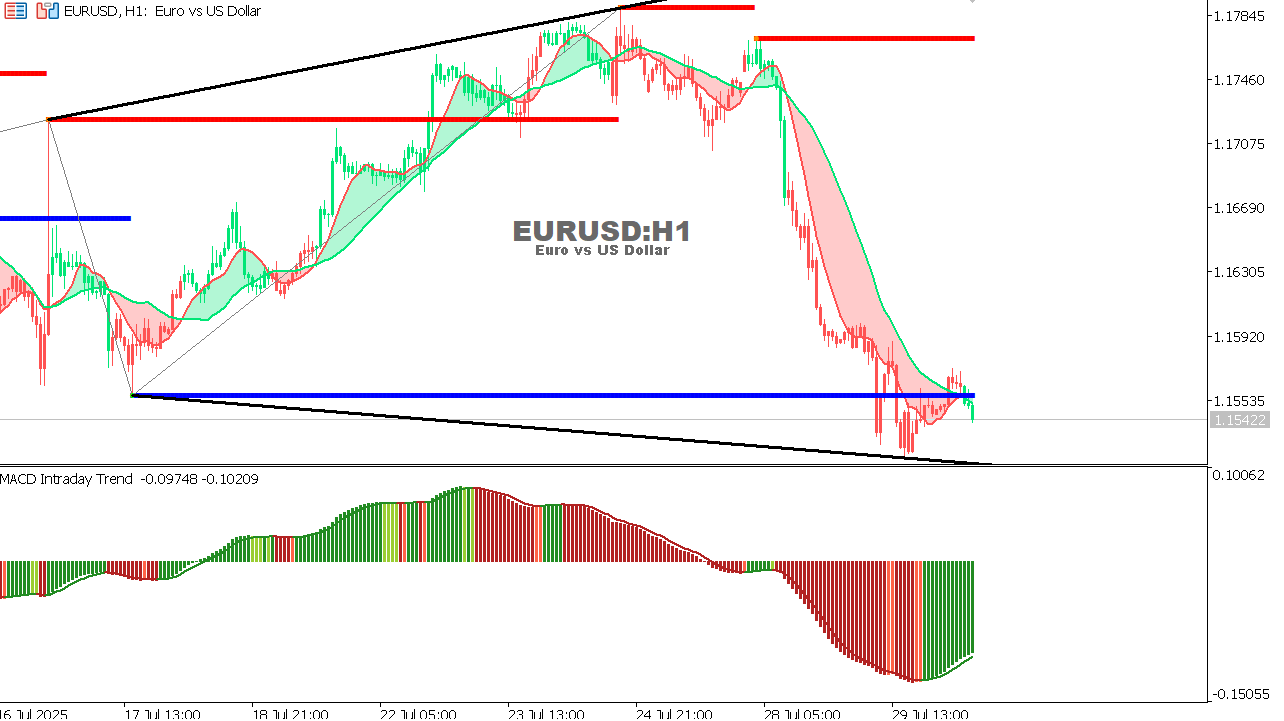
EUR/USD Chart on the hourtly time frame

EUR/USD Chart on the hourtly time frame

  • Current trend: Bearish
  • Technical situation: The price has broken strong support (the blue line) and is currently attempting to retest it from below.
  • MACD: Negative but showing a recovery attempt.
  • Expectation: If the price fails to break above the blue resistance, the decline may resume towards the lower support at 1.1500.
     
USDJPY chart on the hourly time frame

USDJPY chart on the hourly time frame

  • Current Trend: Recently Bullish
  • Technical Status: A strong rebound from sloping support, but the price is beginning to encounter resistance around 148.30.
  • MACD: Positive but weakening.
  • Prediction: If 147.80 is broken downward, it may retest 147.00.


- A look at Friday report on July 29, 2025.

To open Live account click here 

One Trading Account | 50+ Forex Pairs | 80+ Trading Instruments
Multi-Asset Trading Platforms

Cookie Policy
This website uses cookies to ensure you get the best experience on our website. We use cookies for proper website navigation and function and for statistical and analytical purposes. You can select the cookie categories that you would like to manage through the Cookies Settings at any time. Please configure your Cookies Settings before proceeding. To learn more, please read our Cookies Policy