FXEM - EMPIRE MARKETS - Company New Article
To access the website's classic version and the new accounts, please click here
Sep 30, 2025
 |
|
|
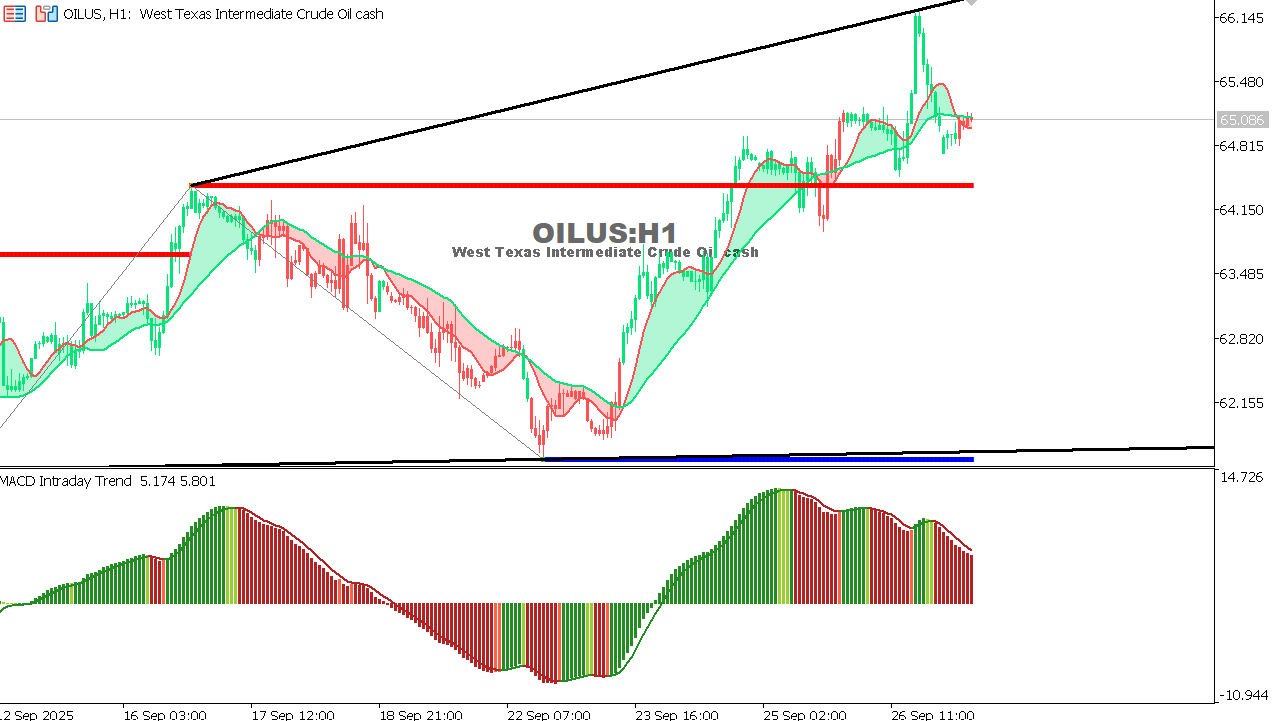 |
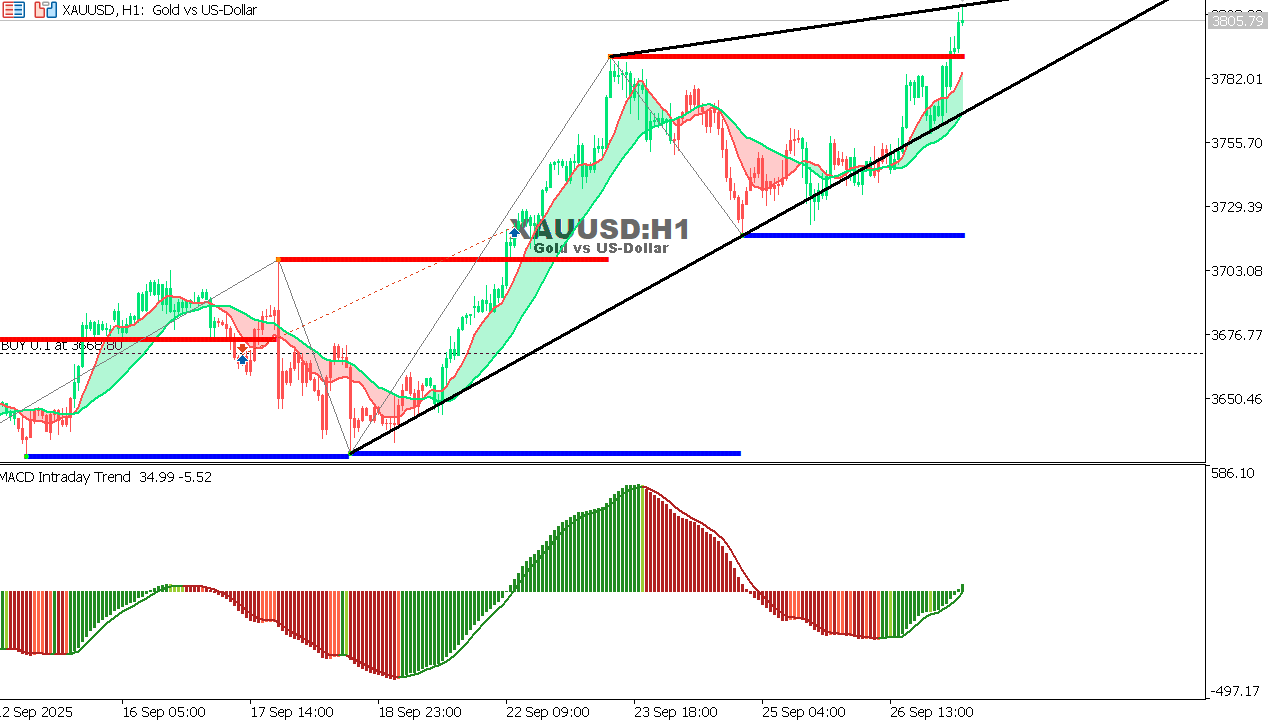
USOIL Chart on the hourtly time frameOil is trading around 62.88 after a previous downward trend, with concerns about weak global demand continuing, coupled with limited support from interest rate cut decisions.
|
 |
|
|
 |
|
|