FXEM - EMPIRE MARKETS - Company New Article
To access the website's classic version and the new accounts, please click here
Oct 14, 2025
 |
|
|
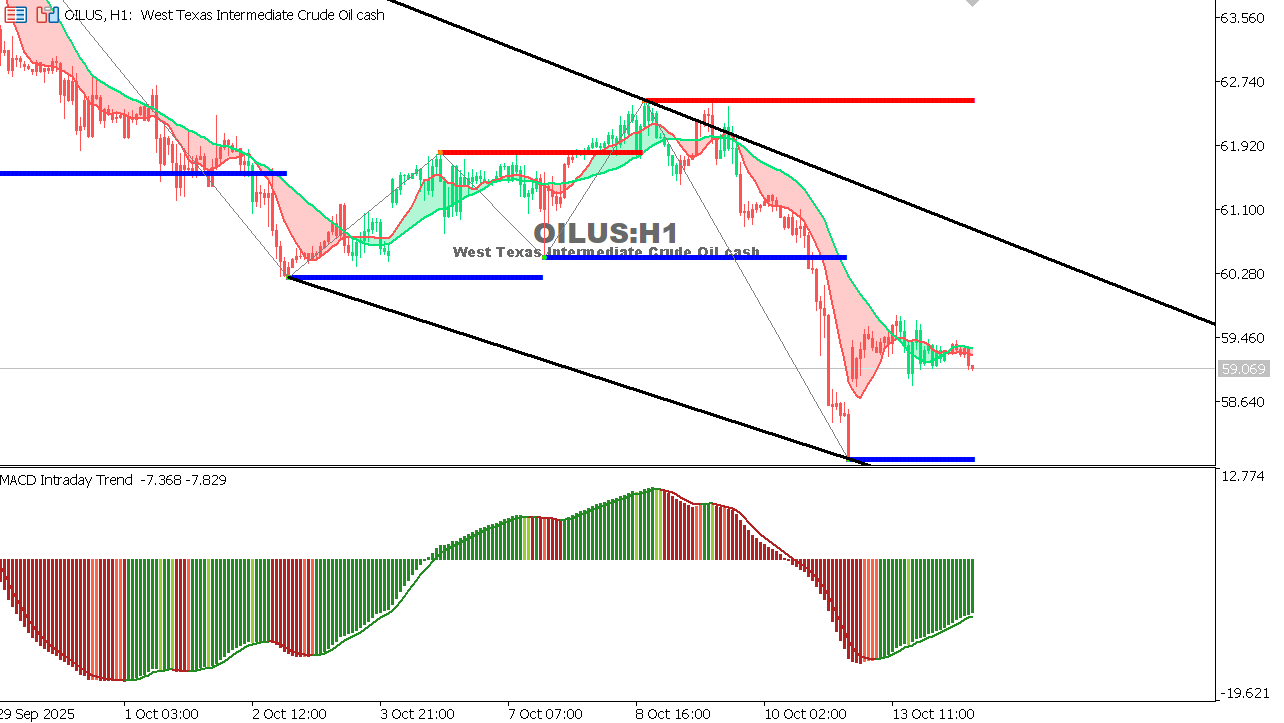 |
USOIL Chart on the hourtly time frameWTI is trading around $59.06 per barrel in a narrow range, following a series of declines due to the weak global demand outlook and ongoing concerns about the Chinese economy. Technically, the MACD indicator is showing a slight downward bias, indicating continued short-term selling pressure. Prominent support is at $58.60, and resistance is at $60.20. Prices are likely to remain stable in the short term, awaiting any signals from the OPEC+ meeting or US inventory data.
|
 |
|
|
 |
|
|