FXEM - EMPIRE MARKETS - Company New Article
To access the website's classic version and the new accounts, please click here
Oct 10, 2025
 |
|
|
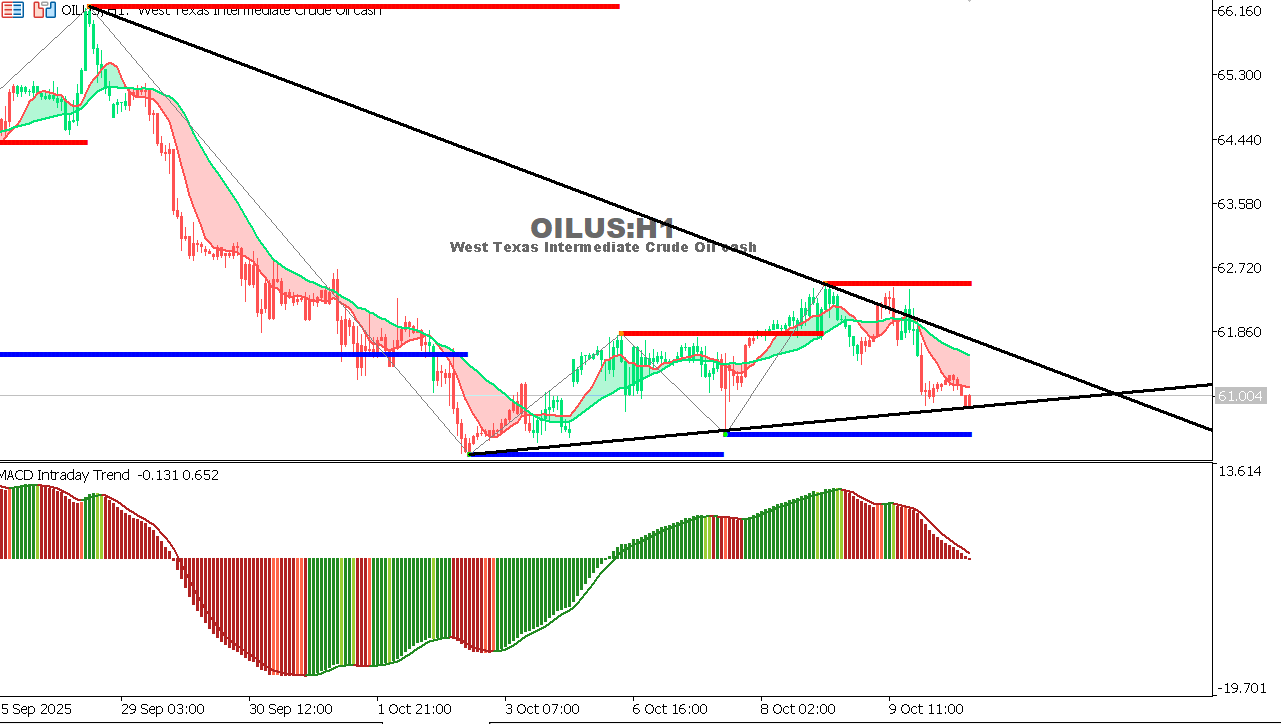 |
USOIL Chart on the hourtly time frame
Forecast:
|
 |
|
|
 |
|
|
To access the website's classic version and the new accounts, please click here
Oct 10, 2025
|
|
|
|
USOIL Chart on the hourtly time frame
Forecast:
|
|
|
|
|
|
|