FXEM - EMPIRE MARKETS - Company New Article
To access the website's classic version and the new accounts, please click here
Nov 17, 2025
 |
|
|
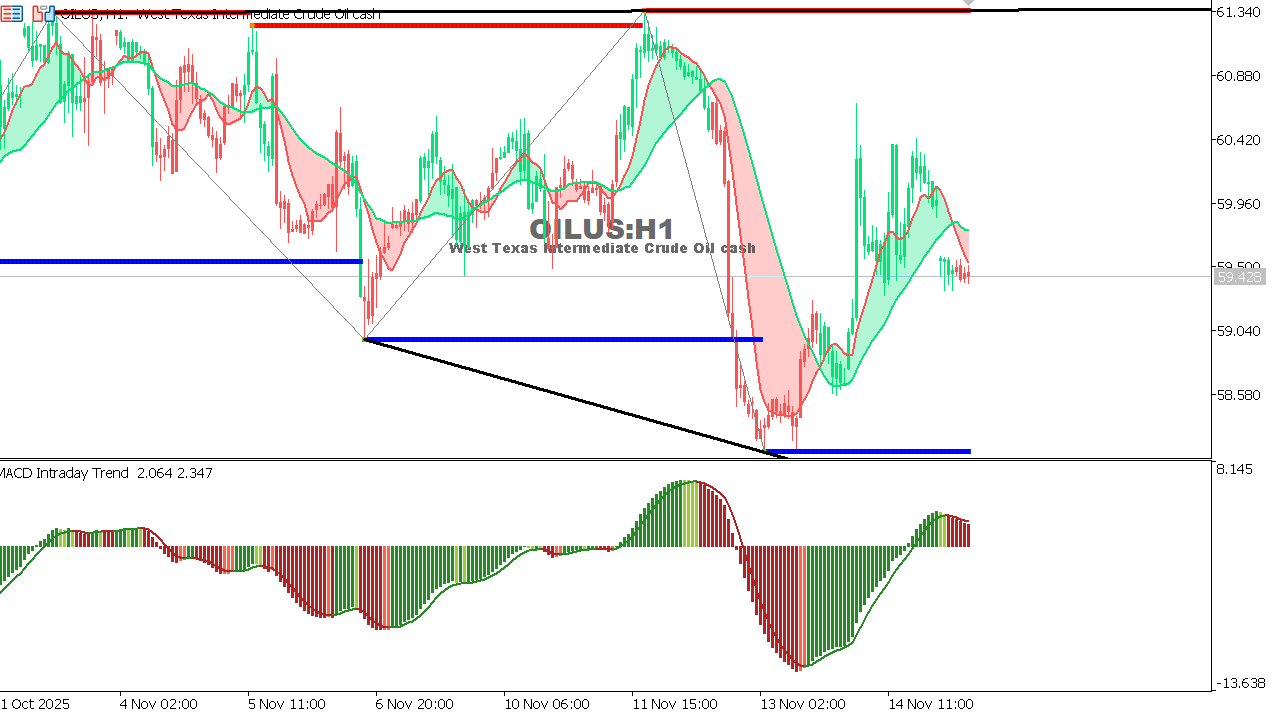 |
USOIL Chart on the hourly time frameOil is trading near a key support level at 59.00 after a strong downward trend that has dominated since the beginning of the week. Risk appetite remains weak, while pressure continues from the strong dollar and expectations of high supply. The price is close to a potential bounce zone, but the overall trend remains bearish as long as it stays below 61.20. General Trend: Downward
Expectation: A bounce is possible from 59.00, but a break below this level would reinforce the downward move towards 57.80.
|
 |
|
|
 |
|
|