FXEM - EMPIRE MARKETS - Company New Article
To access the website's classic version and the new accounts, please click here
Jun 11, 2025
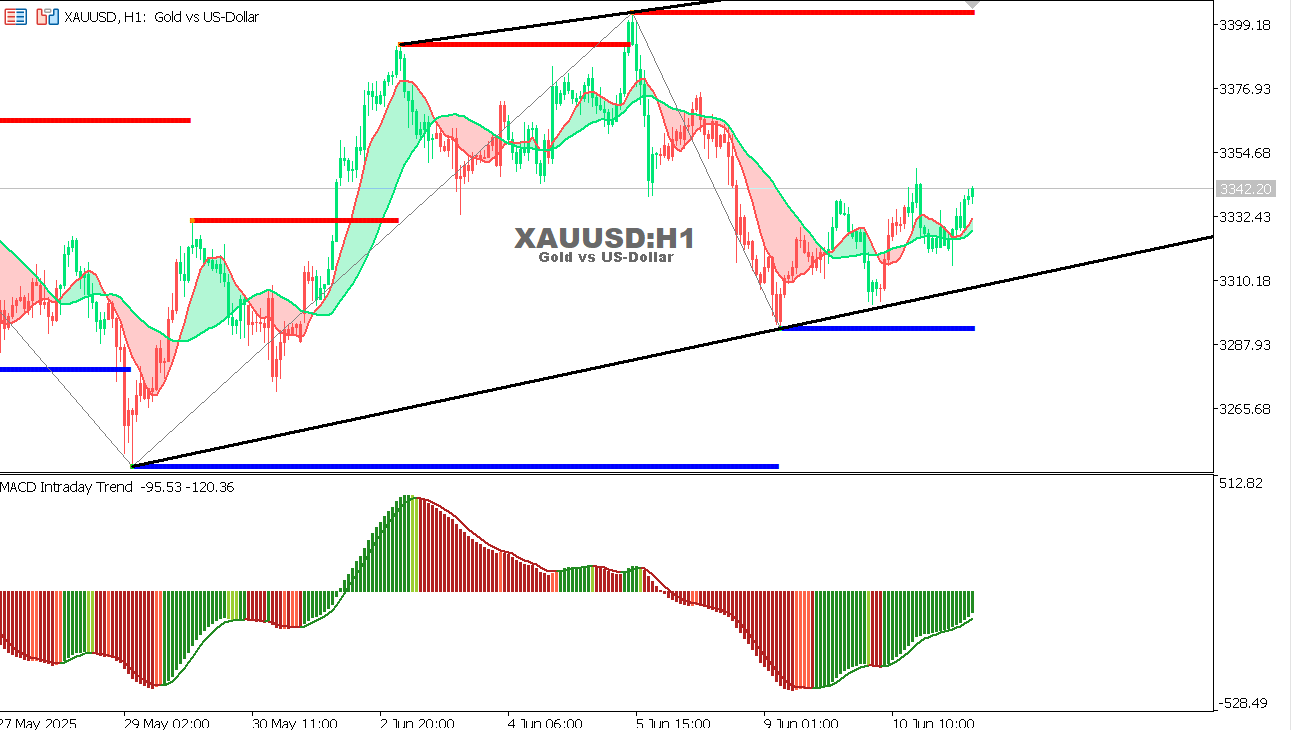 |
Gold chart on the hourly time frameCompared to the Previous Session:
Conclusion: The bearish scenario played out as expected. Price broke below 3320 and reached 3285. Sustained trading below this level signals further downside risk.
◦ 3270 (first target),
◦ 3340, then 3360. |
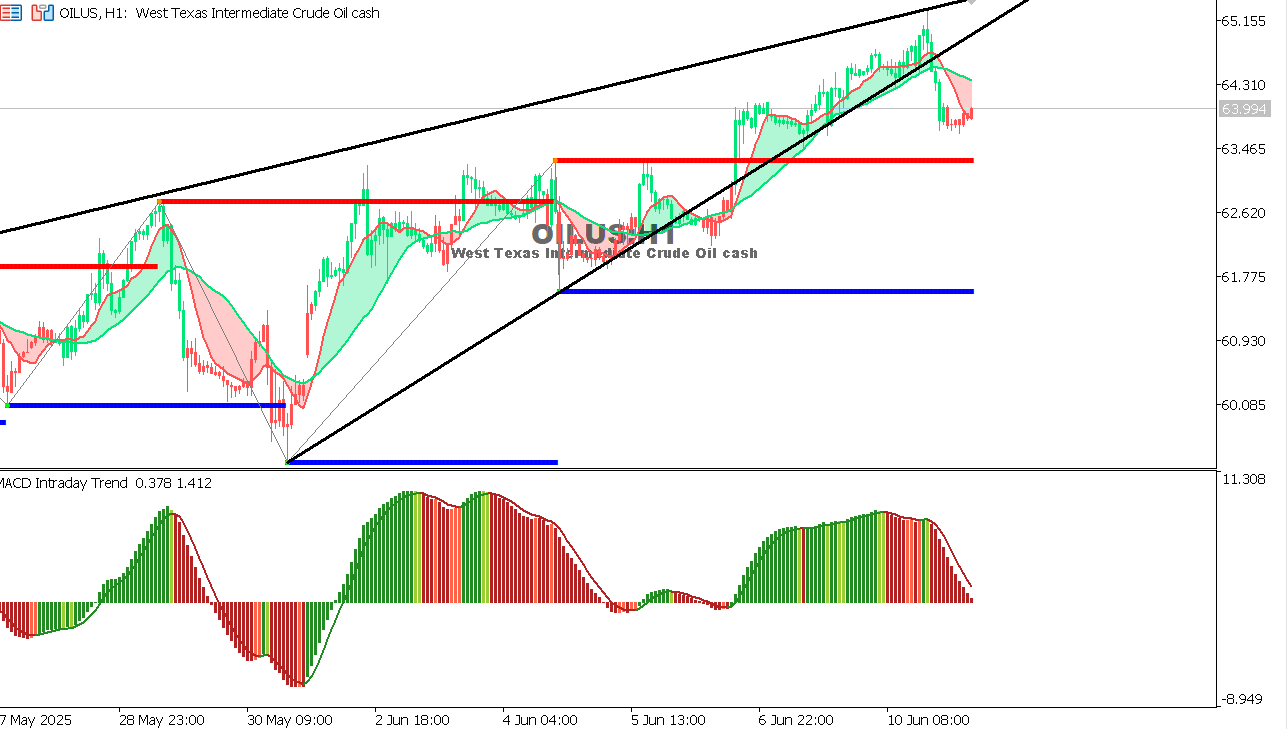 |
US Oil Chart on the Hourly Time FrameCompared to the Previous Session:
Current Technical Outlook:
◦ 62.85 (first target),
|
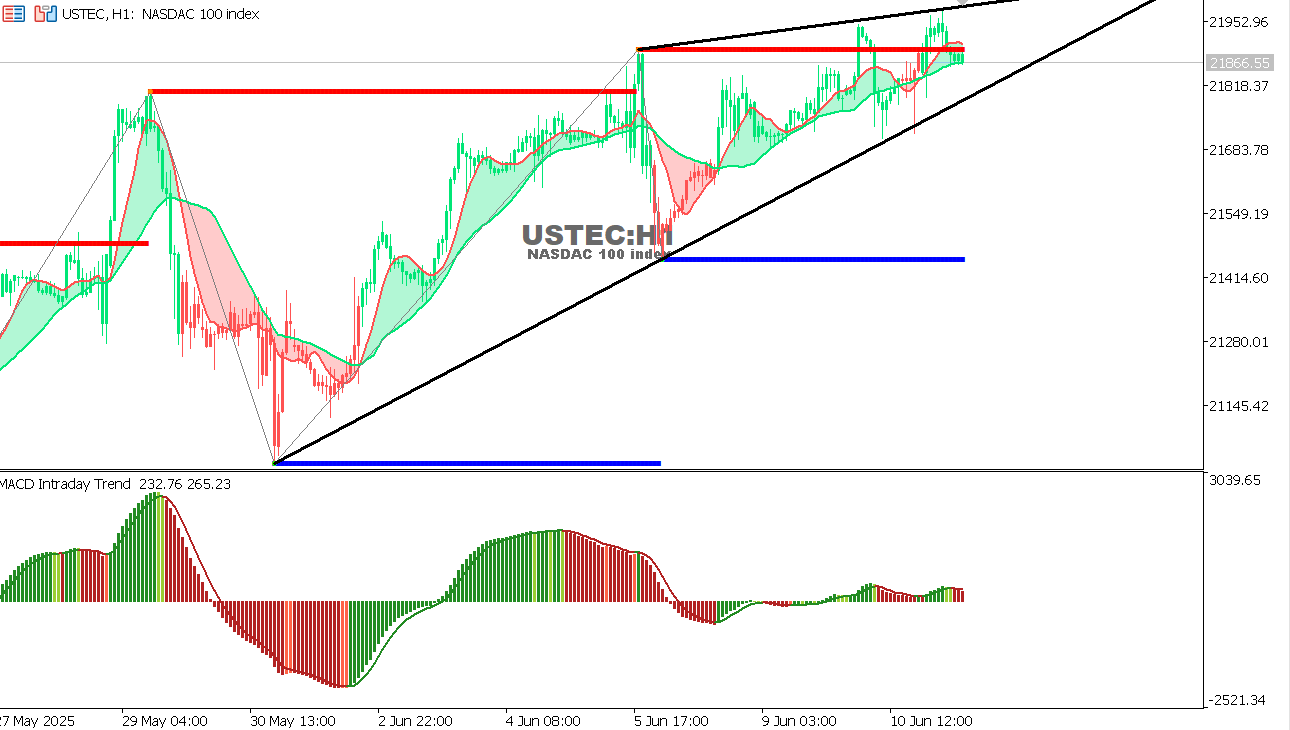 |
USTEC chart on the hourly time frame
Current Situation:
Forecast:
◦ 21950, then ◦ 22100.
|