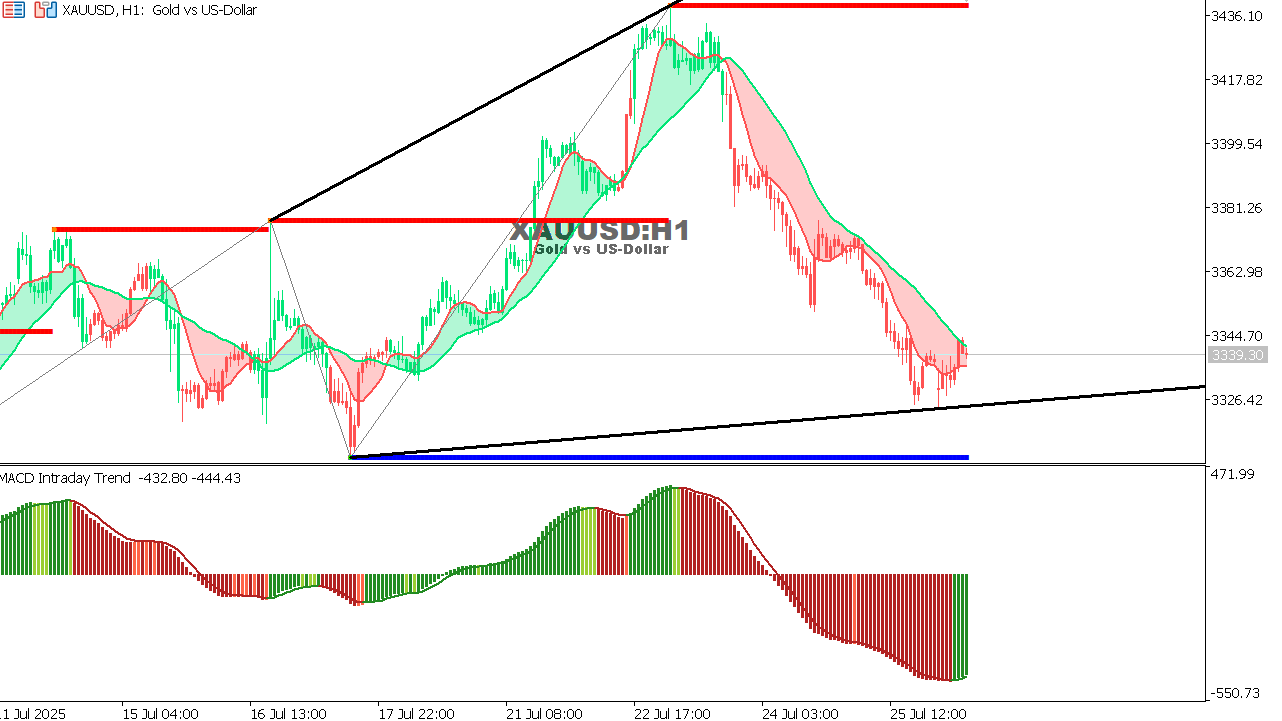
General trend: Bearish correction after an uptrend
Support: 3326
Resistance: 3436
MACD: Continued bearish momentum
Expectation: Gold may continue its decline until the uptrend support, then monitor the reversal from there.
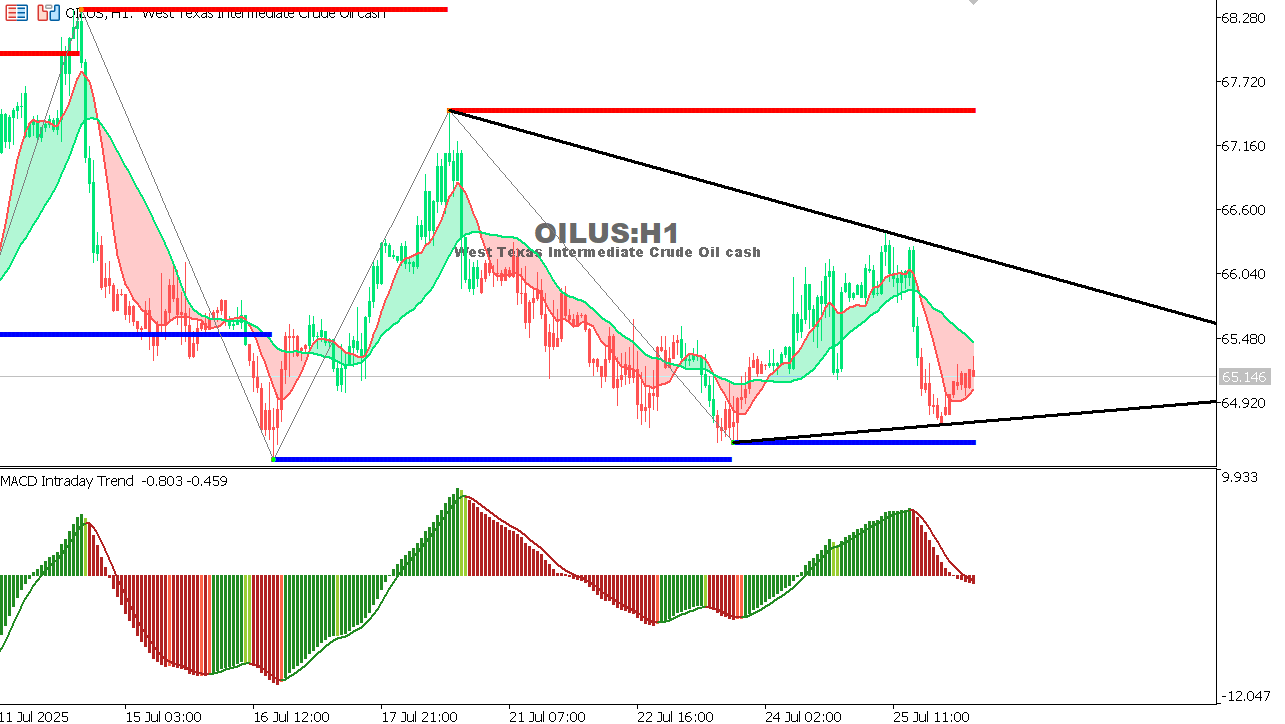
USOIL Chart on the hourtly time frame
General trend: Consolidating triangle (tightening movement)
Support: 64.90
Resistance: 66.60 – 67.70
MACD: Weak with a negative slope
Expectation: The price may attempt to rise towards resistance, but a break of any leg of the triangle will determine the next direction.
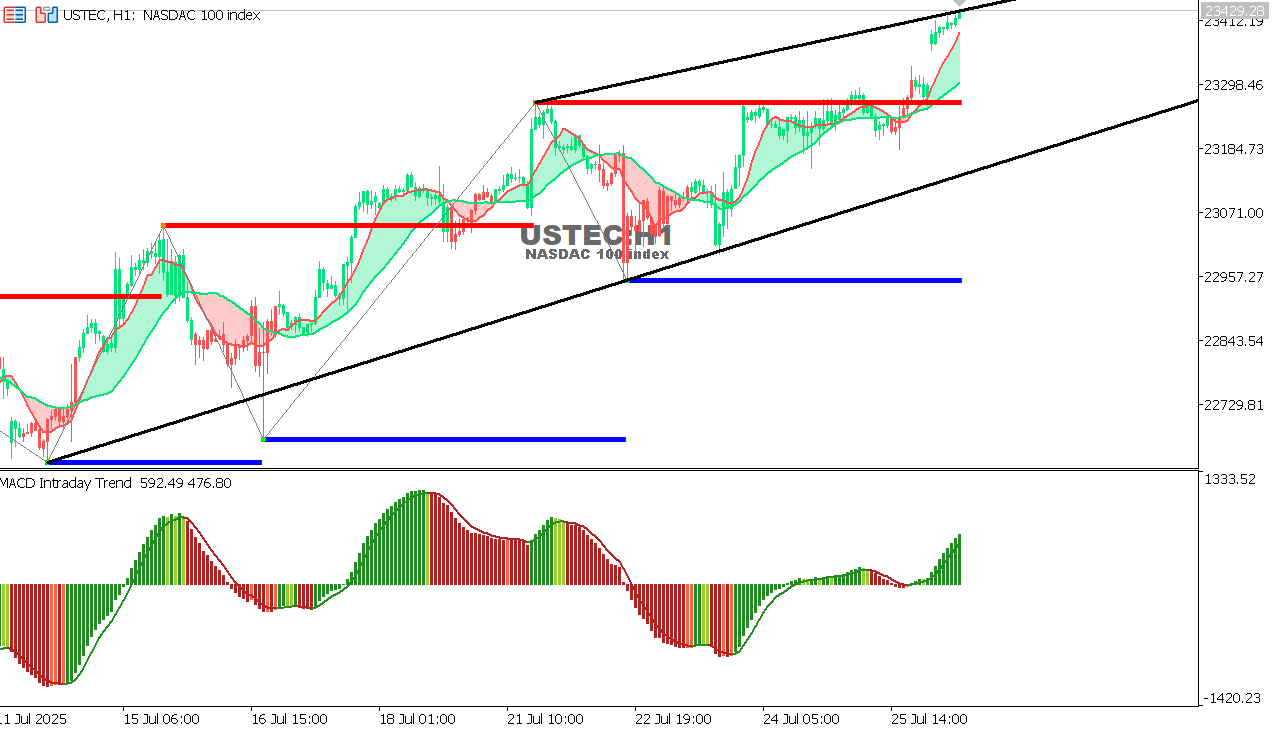
USTEC chart on the hourly time frame
General trend: Strongly bullish within a channel
Support: 23,298 – then 22,957
Resistance: No clear resistance (new highs)
MACD: Strong bullish momentum
Expectation: Continued upward movement unless the initial support is weakened or broken.
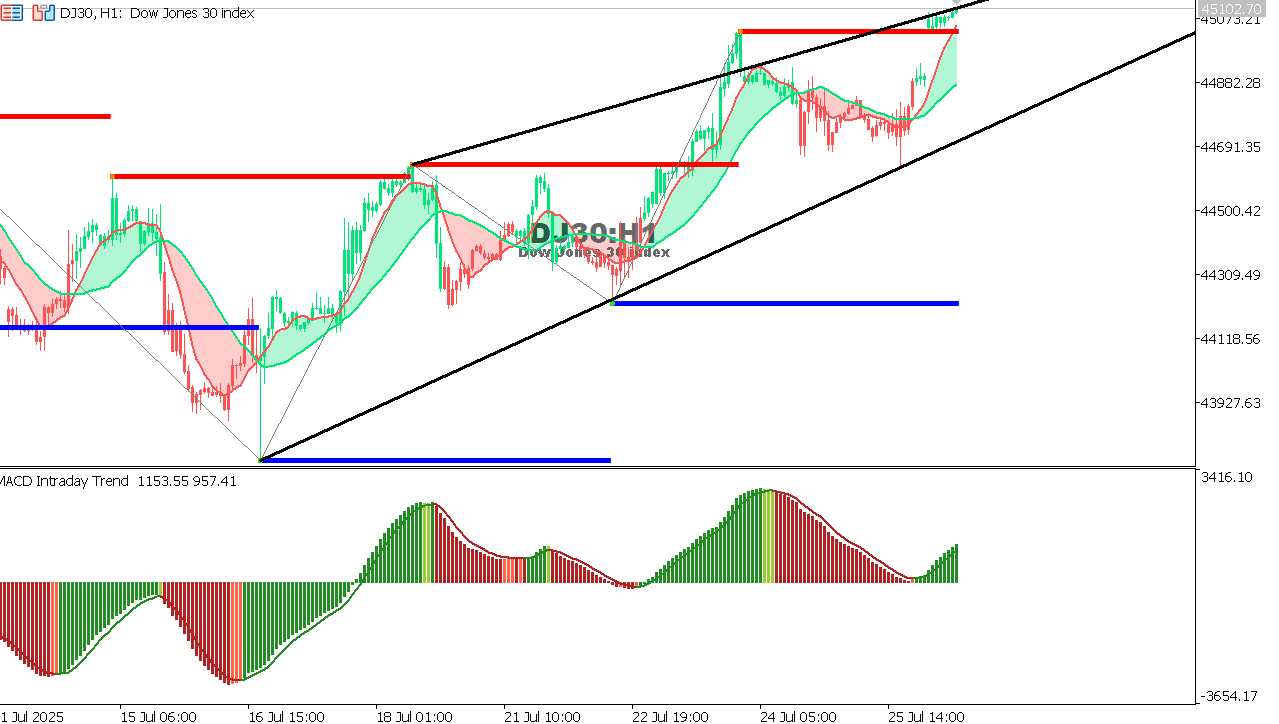
US30 chart on the hourly time frame
General trend: Bullish within a channel
Support: 44,880 – then 44,300
Resistance: 45,100
MACD: Improved upward momentum
Expectation: The index is close to strong resistance at 45,100. Profit-taking or a slight correction is possible, followed by continued upward movement if the support is not broken.
This website uses cookies to ensure you get the best experience on our website. We use cookies for proper website navigation and function and for statistical and analytical purposes. You can select the cookie categories that you would like to manage through the Cookies Settings at any time. Please configure your Cookies Settings before proceeding. To learn more, please read our Cookies Policy
We use cookies to ensure the best possible experience as a guest in our site. Please configure your cookies settings before proceeding.
Necessary
Always active
These cookies are strictly necessary to enable you to move about the website and to provide certain features you have requested. There is no need for consent for the use of such cookies.