FXEM - EMPIRE MARKETS - Company New Article
To access the website's classic version and the new accounts, please click here
Jul 17, 2025
 |
|
|
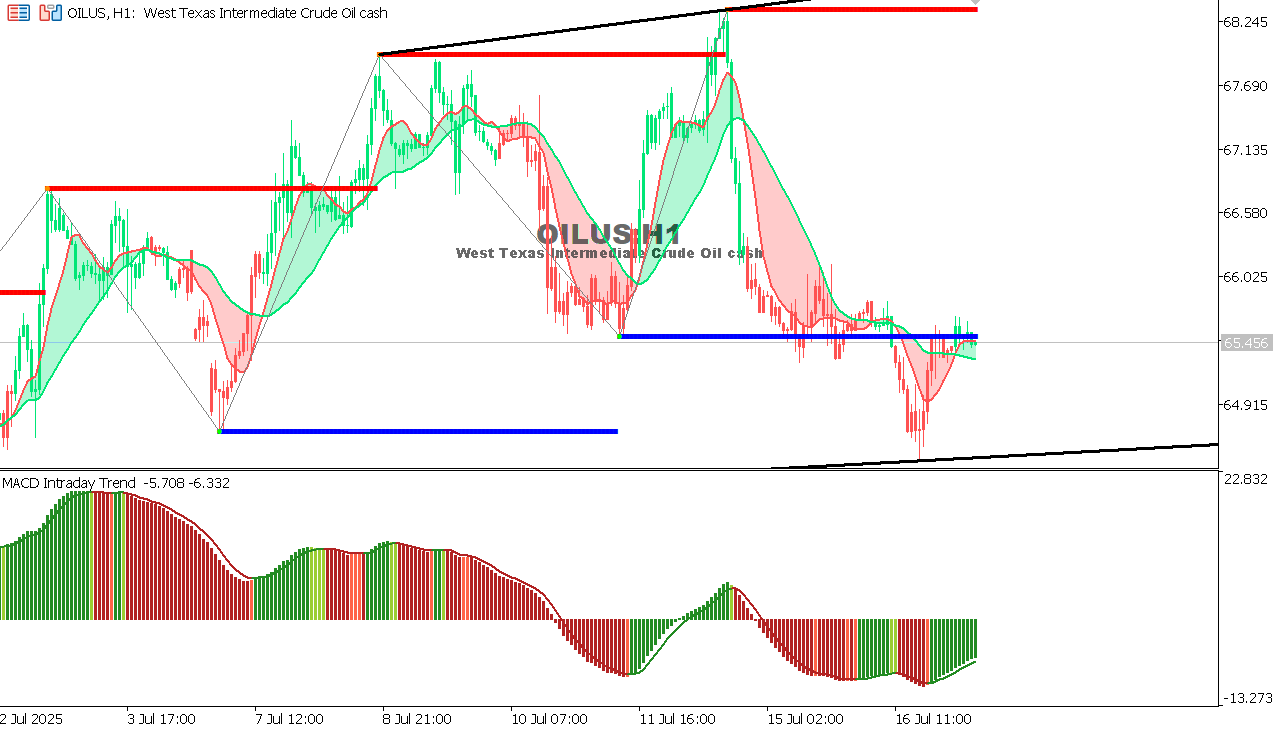 |
USOIL Chart on the hourtly time frameGeneral trend: Upward in the medium term, but currently in a downward correction.
The price is attempting to consolidate above the support level, showing a rebound supported by the moving averages crossing.
|
 |
|
|
 |
|
|