FXEM - EMPIRE MARKETS - Company New Article
To access the website's classic version and the new accounts, please click here
Jul 10, 2025
 |
|
|
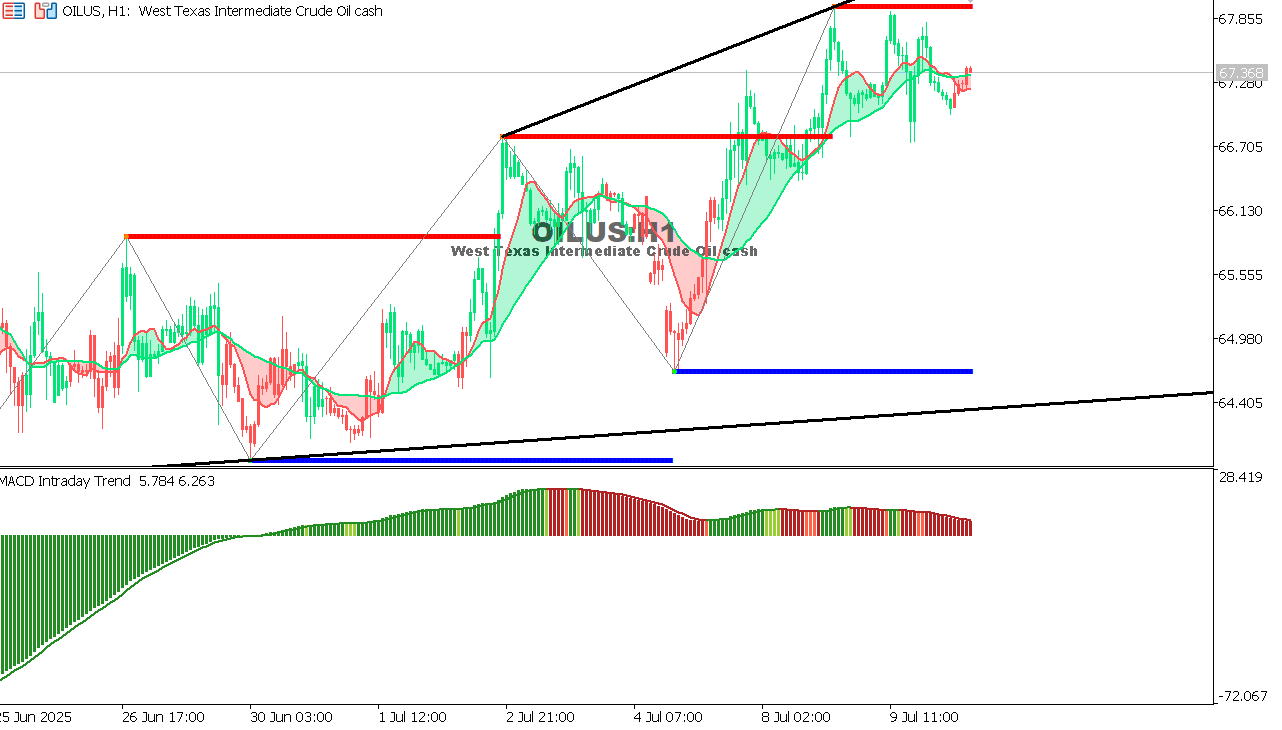 |
USOIL Chart on the hourtly time frameCurrent Situation: Oil is moving in a bearish consolidation range after breaking the 68.00 support level, and is now consolidating near a minor support area.
|
 |
|
|
 |
|
|