FXEM - EMPIRE MARKETS - Company New Article
To access the website's classic version and the new accounts, please click here
Dec 17, 2025
 |
|
|
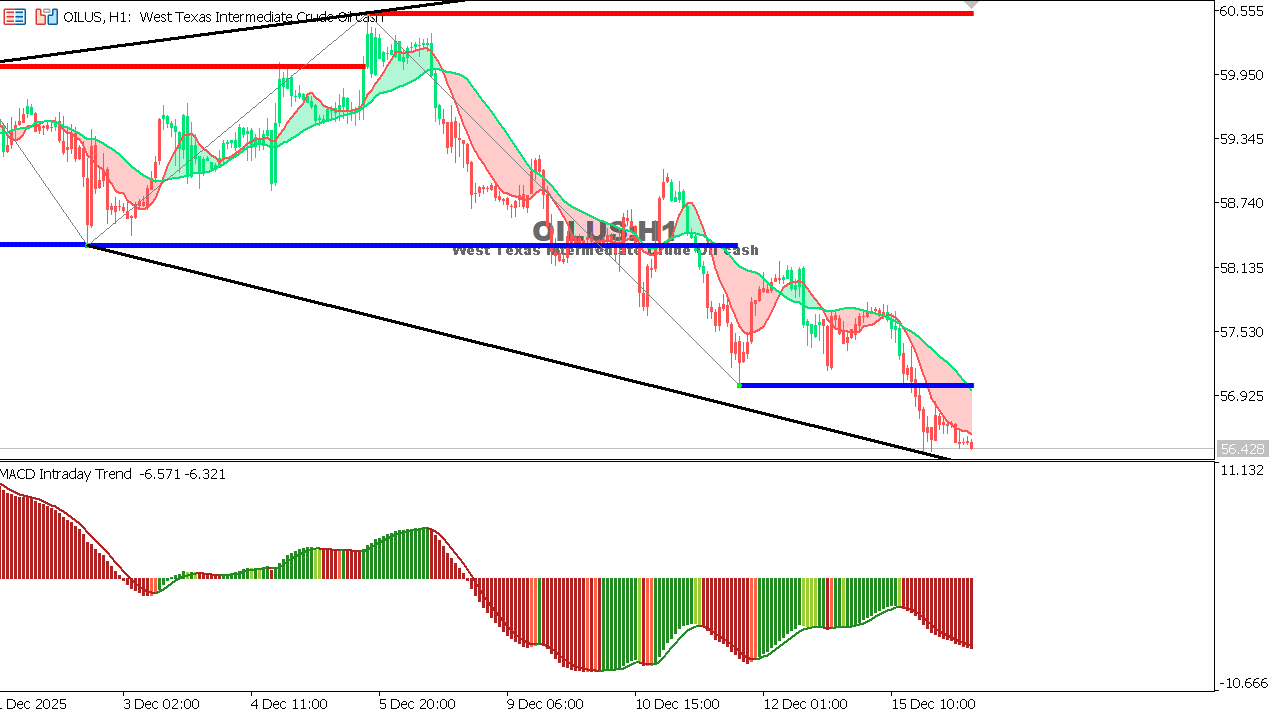 |
USOIL Chart on the hourly time frameOil is moving within a narrow range with a slight downward bias, influenced by profit-taking and persistent concerns about global demand. Holding above 55.60 maintains the potential for consolidation, while a break below this level could deepen the correction. Overall Trend: Neutral Expectation: Sideways movement with a cautious bias until demand and energy data become clearer. |
 |
|
|
 |
|
|