FXEM - EMPIRE MARKETS - Company New Article
To access the website's classic version and the new accounts, please click here
Aug 05, 2025
 |
|
|
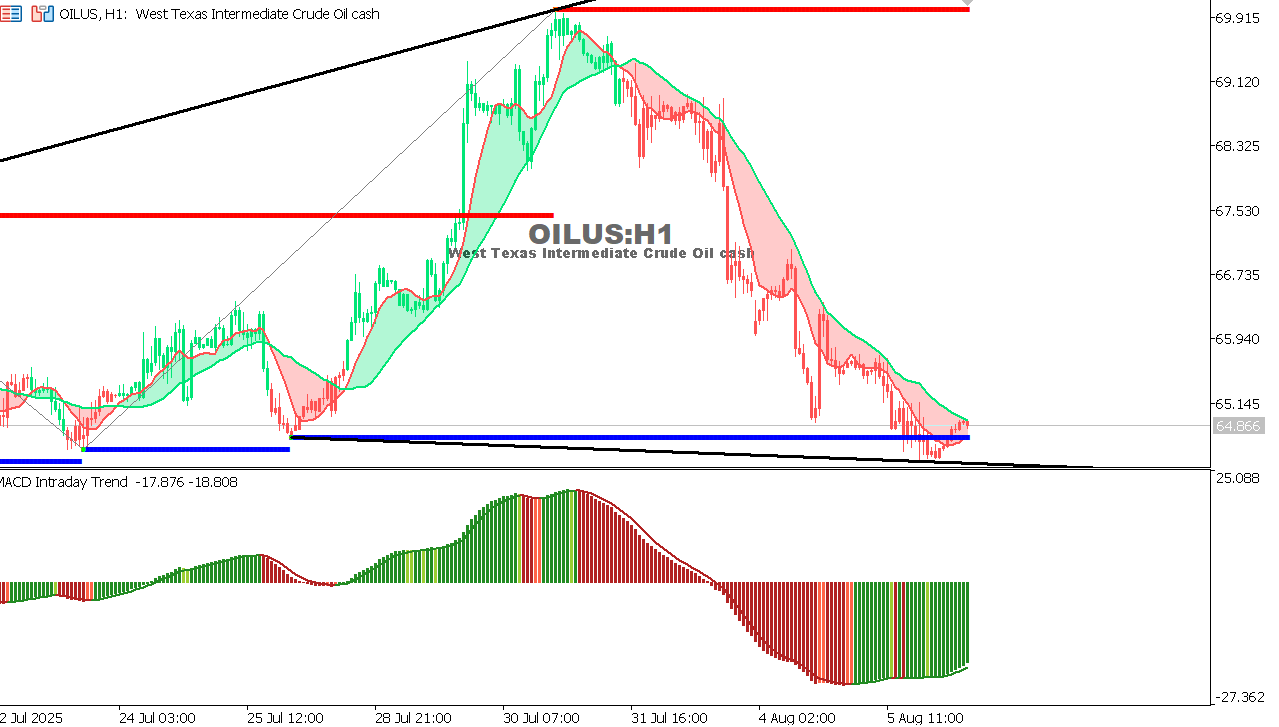 |
USOIL Chart on the hourtly time frameGeneral trend: Bearish corrective after breaking the ascending channel. Nearest support: 65.10 Current resistance: 66.95 Current situation: The price is in a strong support zone (the ascending trend line crosses horizontal support). MACD indicator: Starting to show slight positive signs. Expected scenario: We may witness a temporary upward rebound towards 66.95 and then a retest. A downward trend remains likely if the breakout fails. |
 |
|
|
 |
|
|