FXEM - EMPIRE MARKETS - Company New Article

To access the website's classic version and the new accounts, please click here

May 27, 2025
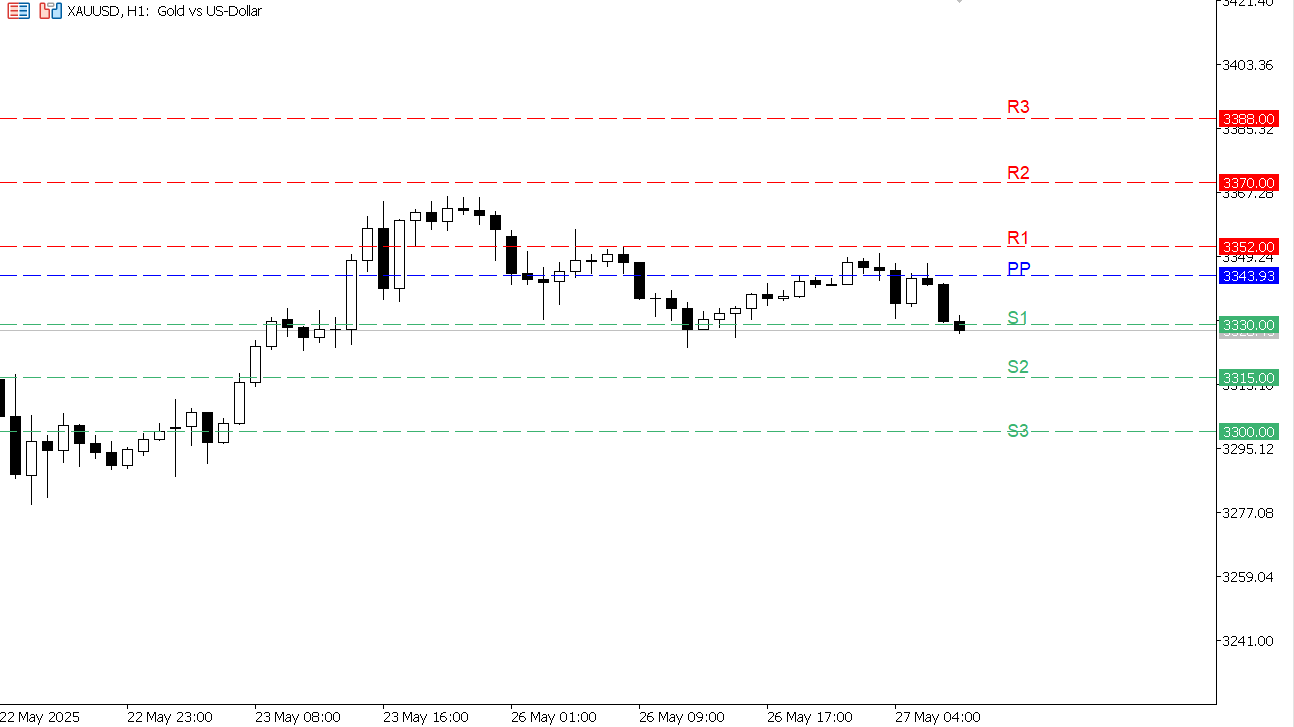
XAU/USD chart on the hourly time frame

XAU/USD chart on the hourly time frame

Gold witnessed a precise downward movement, as we anticipated in yesterday's report, achieving the first downside target at $3335.30, driven by a decline in global risk appetite and a stable dollar.

Expected Technical Levels:

  • Gold may attempt to consolidate above the 3330 level, and a breakout could lead to a move towards $3315 and then $3300.
  • On the upside, any rebound may face resistance at the 3352, 3370, and 3388.00 levels.
Resistance 3 Resistance 2 Resistance 1 Pivot Point Support 1 Support 2 Support 3
3388.00
3370.00
3352.00
3343.93
3330.00
3315.00
3300.00

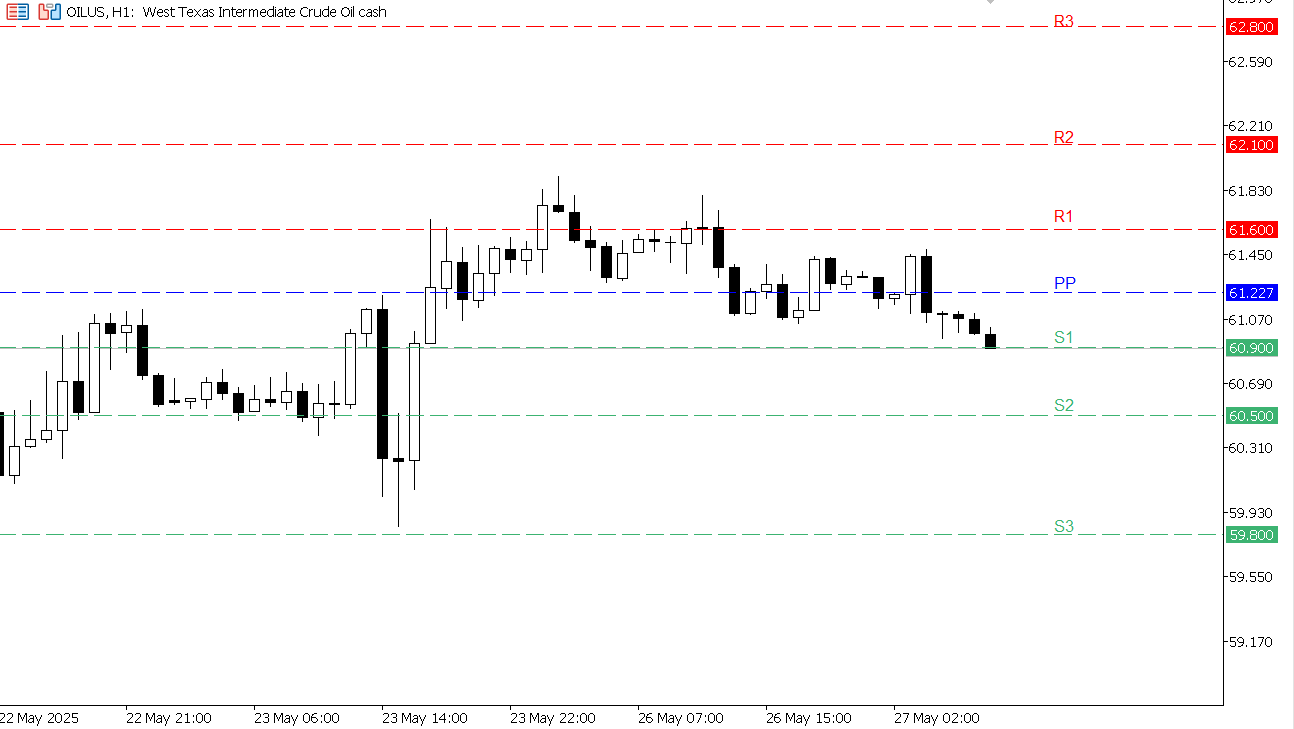
USOIL chart on the hourly time frame

USOIL chart on the hourly time frame

Oil continued to decline, as we indicated in yesterday's report, achieving two technical targets: the first at $61.16 and the second at $60.97, before rebounding slightly at the start of today's trading.

Expected Technical Levels:

  • Nearby support is centered at $60.90 and then $60.50, and a break above this area could push the price towards $59.80.
  • If the price recovers, it may face resistance at $61.60, then $62.10, and then $62.80.
Resistance 3 Resistance 2 Resistance 1 Pivot Point Support 1 Support 2 Support 3
62.80
62.100
61.600
61.227
60.90
60.500
59.800

 To open a real account click here

One Trading Account | 50+ Forex Pairs | 80+ Trading Instruments
Multi-Asset Trading Platforms

Cookie Policy
This website uses cookies to ensure you get the best experience on our website. We use cookies for proper website navigation and function and for statistical and analytical purposes. You can select the cookie categories that you would like to manage through the Cookies Settings at any time. Please configure your Cookies Settings before proceeding. To learn more, please read our Cookies Policy