FXEM - EMPIRE MARKETS - Company New Article
To access the website's classic version and the new accounts, please click here
Dec 24, 2025
 |
|
|
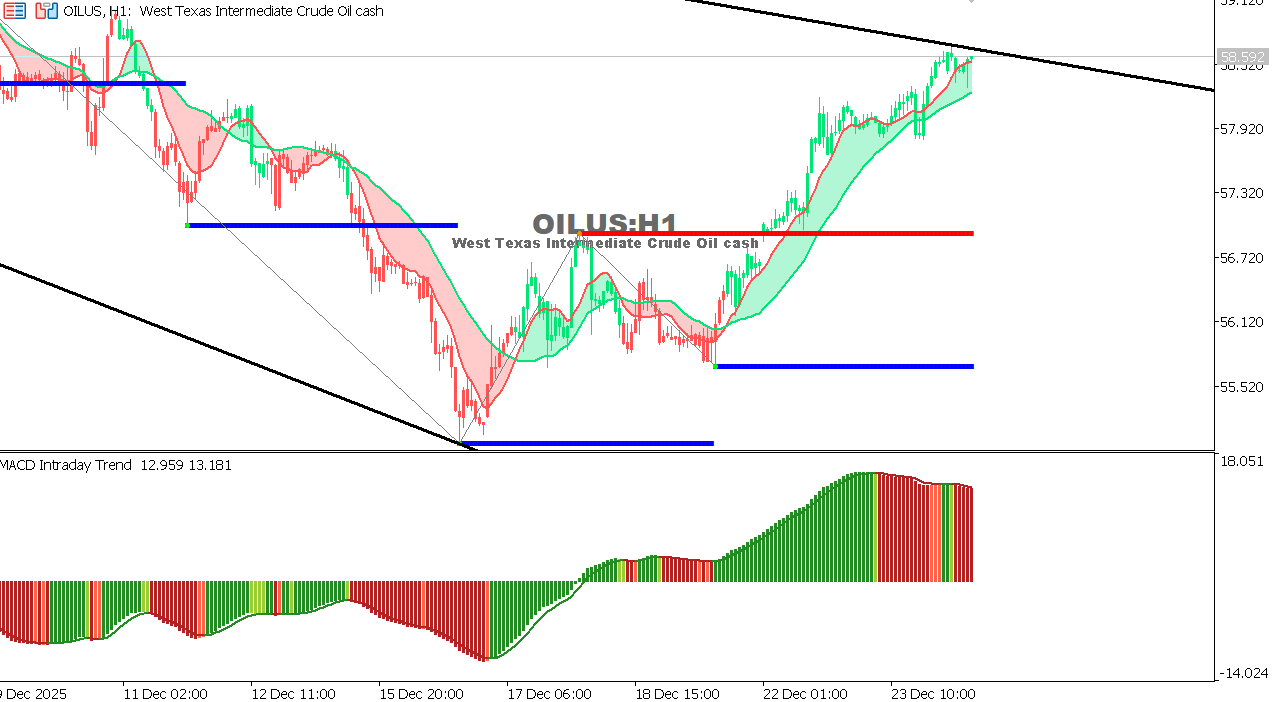 |
USOIL Chart on the hourly time frameOil is moving in a sideways range with an upward bias, balanced between global demand concerns and expectations of stable supply. Seasonal low liquidity is limiting momentum and keeping price action subdued. General Trend: Neutral Expectation: A break above 60.50 could support a new upward wave, while a break below 57.20 would bring back selling pressure. |
 |
|
|
 |
|
|