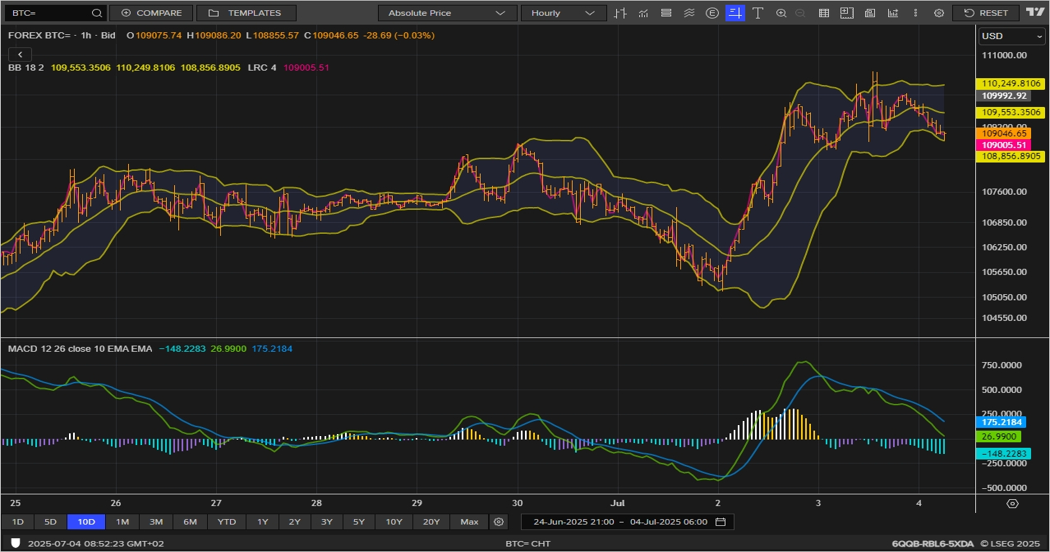
Previously, we wrote; “BTC is currently re-testing the 109K as previously expected. A break above this level should trigger a decent directional move towards (117-120)K range over the next 2 weeks.”
BTC, failed to maintain upside momentum yesterday as prices slipped lower by session’s end.
Currently, we see support at the following levels 108.6K and 107.60K.
Moreover, we continue to see the previously mentioned upside potential.
This website uses cookies to ensure you get the best experience on our website. We use cookies for proper website navigation and function and for statistical and analytical purposes. You can select the cookie categories that you would like to manage through the Cookies Settings at any time. Please configure your Cookies Settings before proceeding. To learn more, please read our Cookies Policy
We use cookies to ensure the best possible experience as a guest in our site. Please configure your cookies settings before proceeding.
Necessary
Always active
These cookies are strictly necessary to enable you to move about the website and to provide certain features you have requested. There is no need for consent for the use of such cookies.