FXEM - EMPIRE MARKETS - Company New Article
To access the website's classic version and the new accounts, please click here
Jan 08, 2026
 |
|
|
 |
||
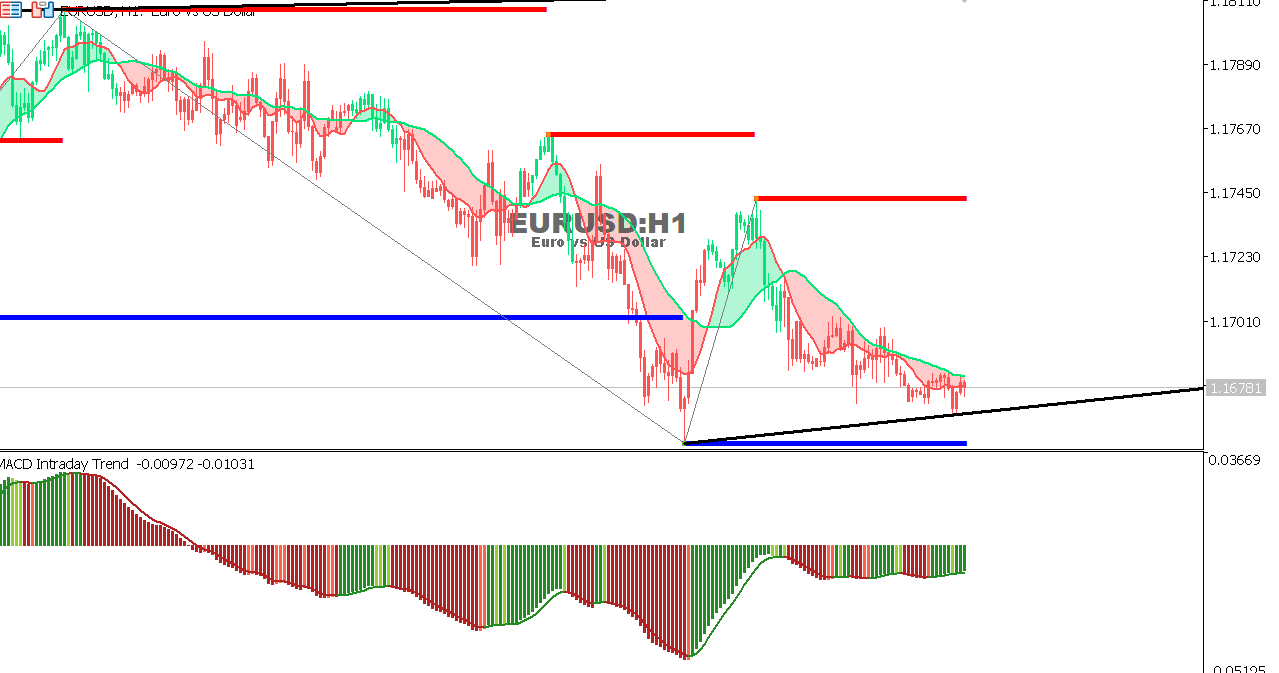
EUR/USD Chart on the hourtly time frameThe pair moves sideways within a neutral range, showing weak buying momentum, with MACD in negative territory. A break below 1.1650 may push the pair toward 1.1620, while a rebound above 1.1745 could support a temporary recovery attempt. Overall Trend: Neutral
|