FXEM - EMPIRE MARKETS - Company New Article
To access the website's classic version and the new accounts, please click here
Jan 30, 2026
 |
|
|
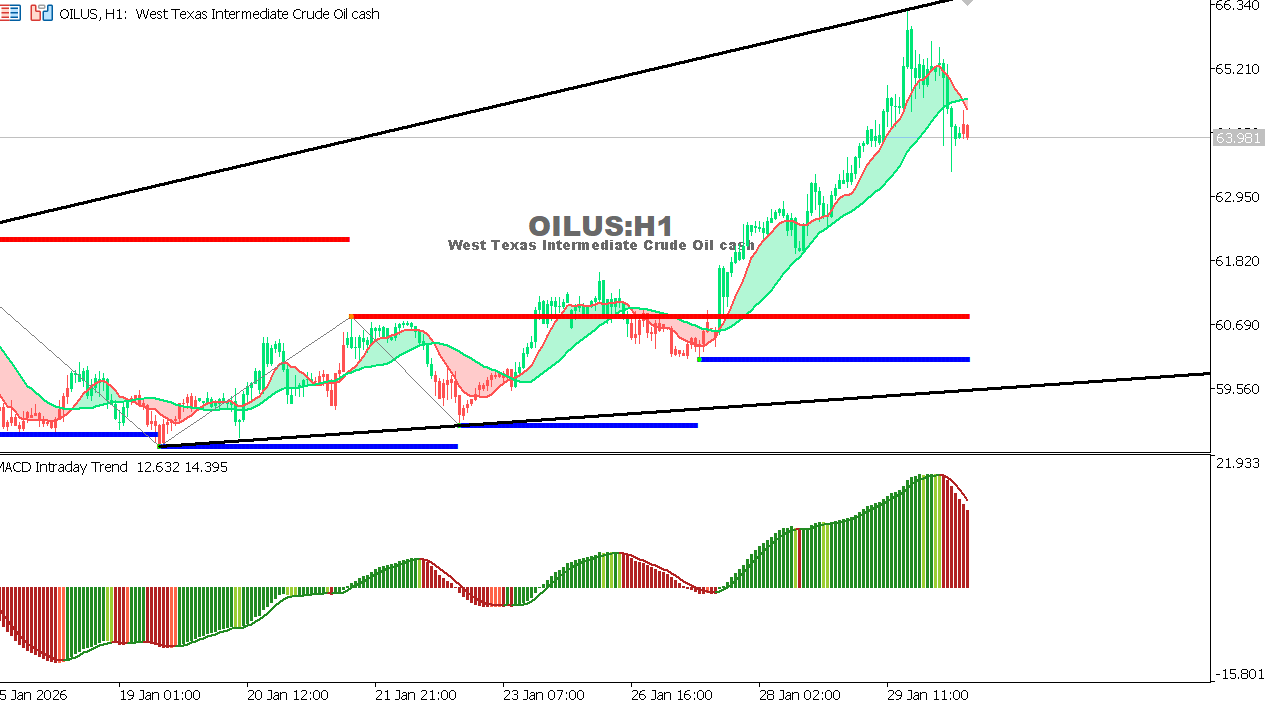 |
USOIL Chart on the hourly time frameOil is moving in a moderately positive range, attempting to stabilize above key support levels, amid a balance between global demand concerns and supply management expectations. General Trend: Neutral with a slight upward bias
|
 |
|
|
 |
|
|