FXEM - EMPIRE MARKETS - Company New Article
To access the website's classic version and the new accounts, please click here
Dec 29, 2025
 |
|
|
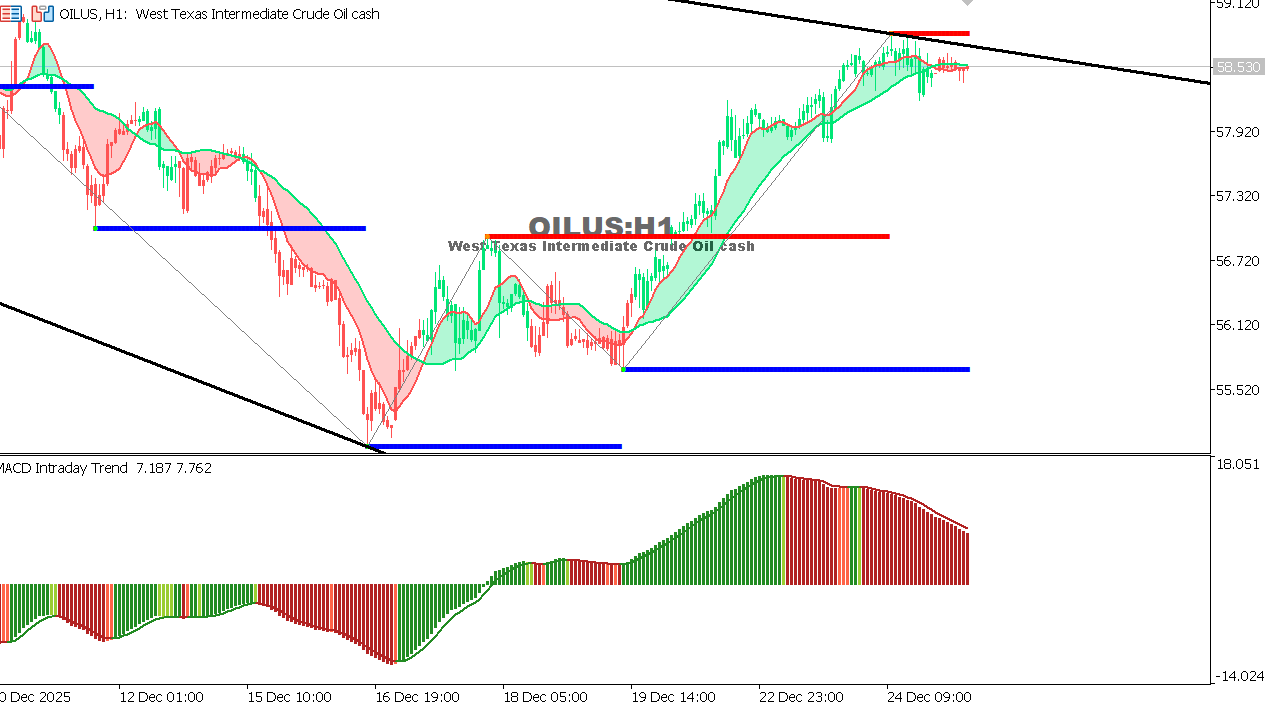 |
USOIL Chart on the hourly time frameOil is trading within a narrow consolidation range following a previous rally, supported by a weaker dollar and market anticipation of the 2026 demand outlook. The price is holding above its moving averages, but momentum is gradually losing strength. The MACD indicator remains positive but shows a clear slowdown, suggesting a potential sideways movement before the next trend is established. Overall Trend: Neutral with a slight upward bias Expectation: Holding above 56.80 supports a retest of 58.10, while a break below 56.20 could trigger corrective pressure. |
 |
|
|
 |
|
|