FXEM - EMPIRE MARKETS - Company New Article
To access the website's classic version and the new accounts, please click here
Dec 01, 2025
 |
|
|
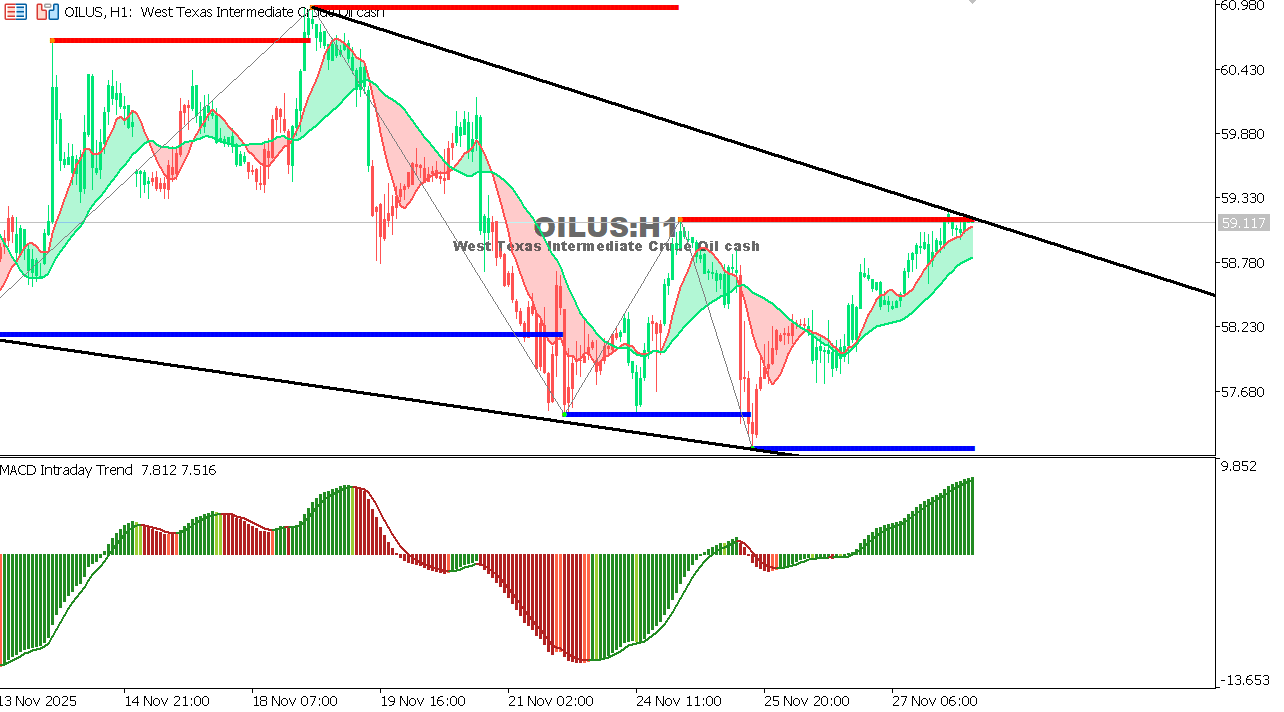 |
USOIL Chart on the hourly time frameOil trades at $59.67, showing moderate stability as markets await clarity on potential additional production cuts from OPEC+. Momentum remains mixed, and the price is struggling to break above the $60.20 resistance area. Overall Trend: Neutral Outlook: |
 |
|
|
 |
|
|