FXEM - EMPIRE MARKETS - Company New Article
To access the website's classic version and the new accounts, please click here
Apr 06, 2026
Technical analysis of some commodities pairs:
Technical Analysis Report (April 6, 2026):
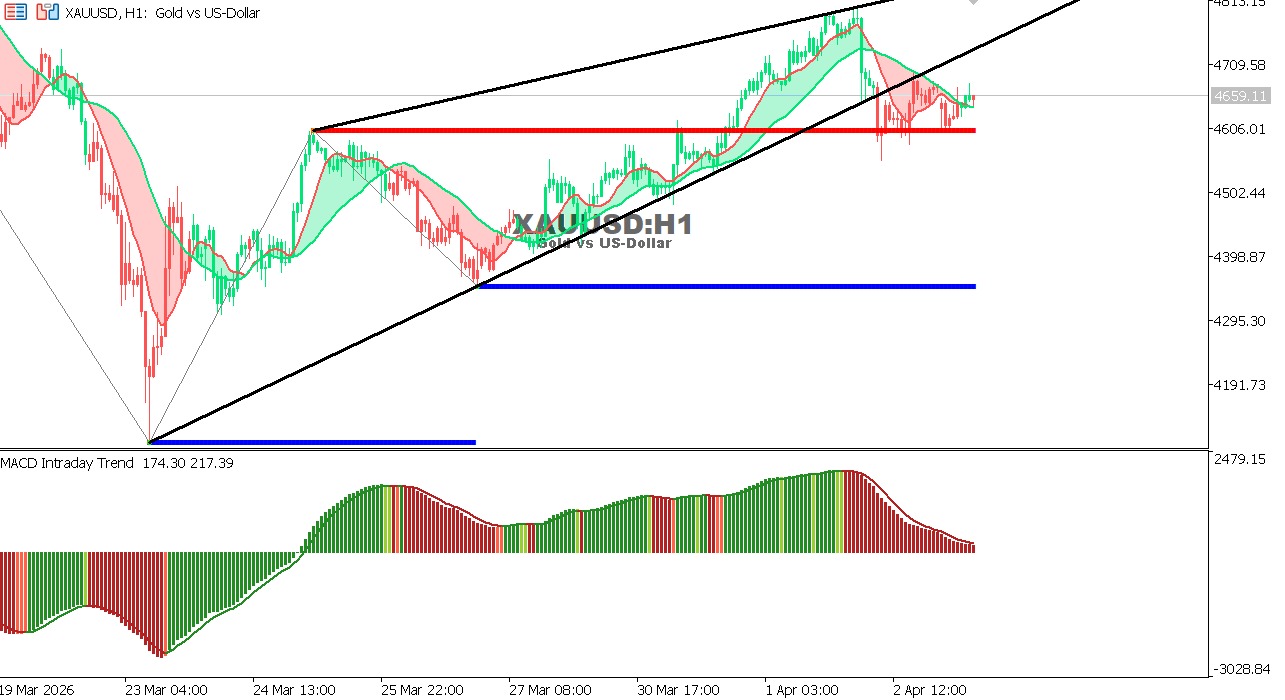
XAUUSD Hourly Chart
Gold is currently trading near 4659.11 after a strong bounce from support levels and is approaching the upper trend line.
Despite the continued positive trend, the MACD indicator shows some slowdown in momentum, which may indicate a pause or short correction before the upward movement resumes.
- General Trend: Upward
- Support: 4600 – 4550
- Resistance: 4700 – 4760
Expectation: Holding above 4600 supports the continuation of the upward movement, while a break below this level could push the price towards 4550 for a deeper correction.
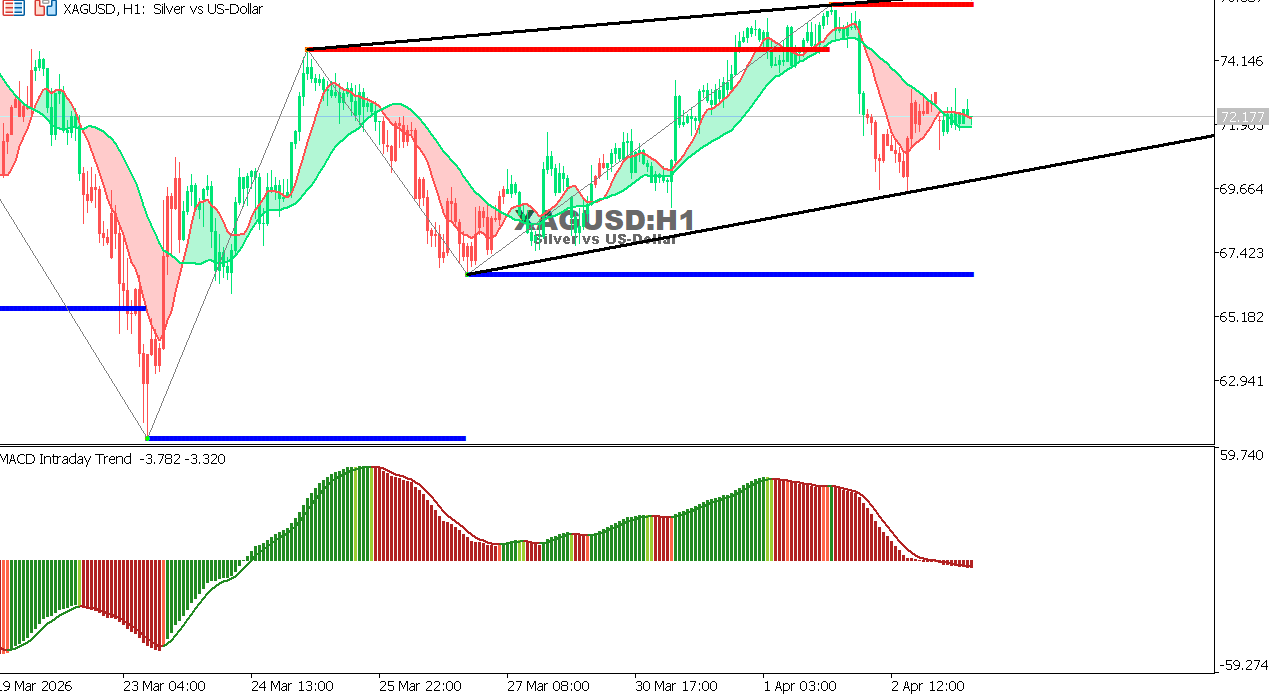
XAGUSD Hourly Chart
Silver is trading near 72.17 in a strong upward trend, with positive momentum continuing despite some slowdown.
The price is approaching resistance levels that may lead to a short pause.
- General Trend: Upward
- Support: 70.50 – 69.00
- Resistance: 73.50 – 75.00
Expectation: Continued upward movement with the possibility of a limited correction
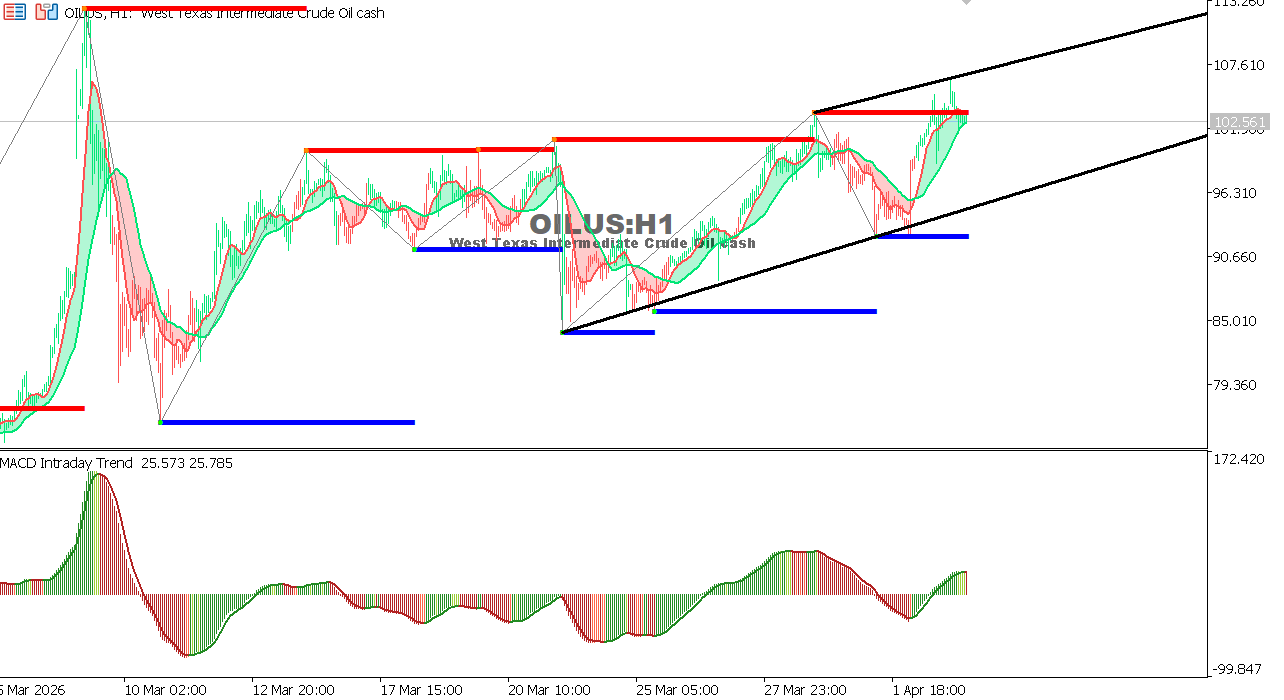
USOIL Hourly Chart
Oil is trading near 102.56 with relative stability after an upward surge, but it faces clear resistance limiting further gains.
Momentum is weakening as demand-related pressures increase.
- General Trend: Neutral with a slight downward bias
- Support: 100.50 – 98.80
- Resistance: 103.50 – 105.00
Expectation: A break below 100.50 supports a downward move, while a break above 103.50 would restore upward momentum.
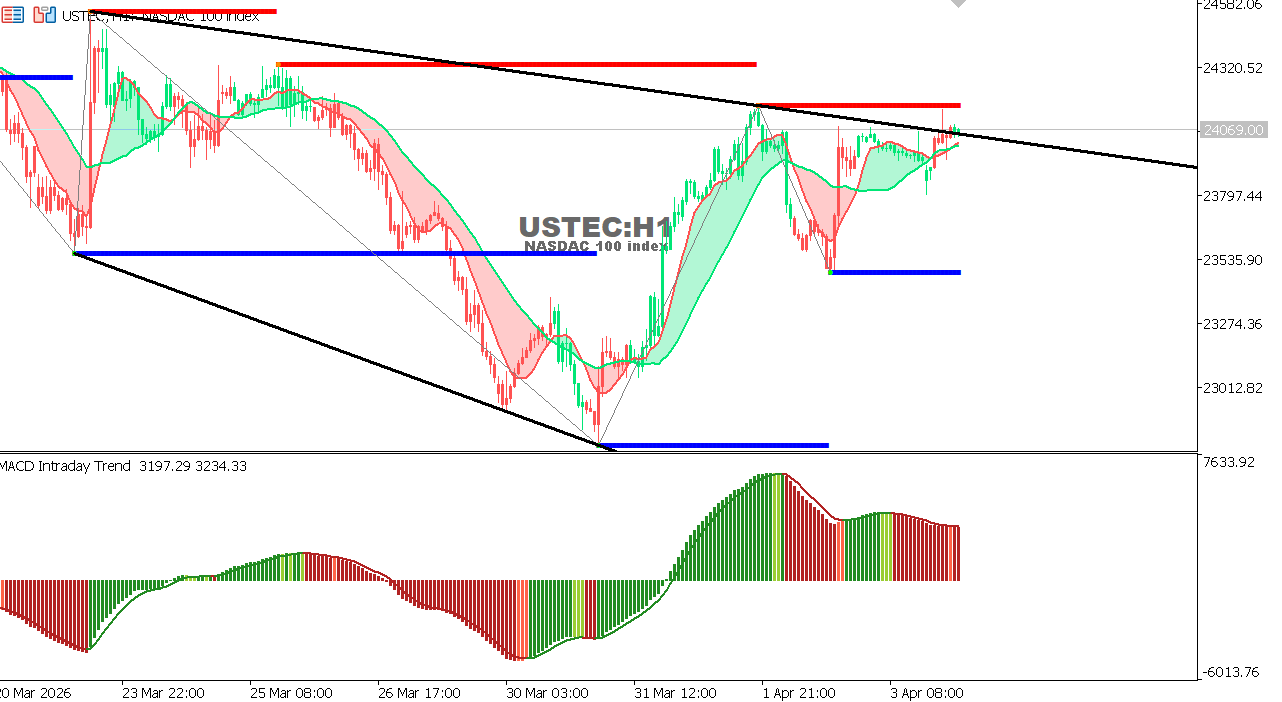
USTEC Hourly Chart
The index is trading near 24069 within a strong upward trend, supported by continued support from technology stocks.
Momentum is positive with the possibility of limited volatility.
- General Trend: Upward
- Support: 23650 – 23300
- Resistance: 24250 – 24600
Expectation: Continued upward movement towards 24250 and then 24600 with limited corrections.
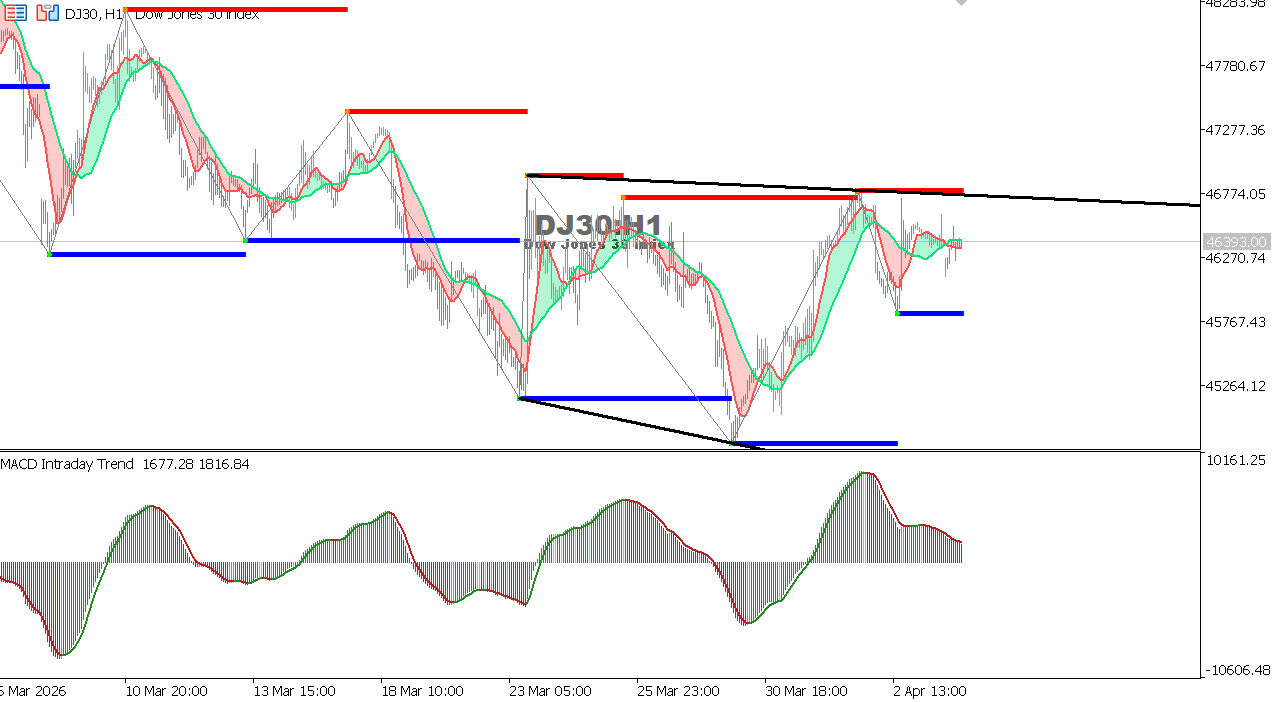
US30 Hourly Chart
The index is trading near 46393, maintaining its upward trend supported by improved market sentiment.
The market is showing strength, but a temporary pullback is possible.
- General Trend: Upward
- Support: 46000 – 45500
- Resistance: 46550 – 47000
Expectation: Gradual upward movement towards 46550 and then 47000 with potential for fluctuations.